|
telescopeѲptics.net
▪
▪
▪
▪
▪▪▪▪
▪
▪
▪
▪
▪
▪
▪
▪
▪ CONTENTS
2.2.
Telescope resolution
Resolution is another
vital telescope function. Simply put, telescope resolution limit
determines how small a
detail can be resolved in the image it forms. In the absence of
aberrations, what determines limit to resolution is
the effect of diffraction. Being subject to eye
(detector) properties, resolution varies with detail's shape, contrast,
brightness and wavelength.
The conventional indicator of resolving power - commonly called
diffraction resolution limit - is the minimum resolvable separation
of a pair of close point-object images, somewhat arbitrarily set forth by
the wave theory at ~λ/D
in radians for incoherent light, λ
being the wavelength of light, and D the aperture diameter (expressed in
arc seconds, it is 134/D for D in mm, or 4.5/D for D in inches,
both for 550nm wavelength).
Resolving two point sources is inevitably dependent
on telescope
magnification. If the images of two point of light are to be fully
resolved, they need to be separated by at least a single non-illuminated
retinal photoreceptor (presumably cone, since the resolution limit of
rods is significantly lower). Reaching near 100% of the diffraction
limit for point-sources requires very high magnifications, but the gain
in resolution is relatively small after about 25x per inch of aperture.
While there is no difference in a single point-source
imaging between coherent and
incoherent light with respect to the relative intensity distribution -
as long as light remains near monochromatic - the resolution limit
for a pair of point sources for the former varies with the
phase difference between the two sources, from ~2λ/D
with zero phase difference, to ~λ/D
with π/2 phase difference, and
about twice better than that with the phase difference equaling π
(i.e. λ/2), as shown on
FIG. 12 left (from Optical Imaging and Aberrations 2, Mahajan).
Since, according to Van Cittert-Zernike
Theorem, light arriving from stars is coherent in amateur-size
telescopes, as long as it is near monochromatic, it is an interesting
question how much this coherence factor, changing with the wavelength
bandwidth and source OPD,
influences the actual resolution limit in the field.
The point-source diffraction resolution
limit for incoherent light, coherent light with λ/4 OPD between
components and, perhaps, specific cases of partly coherent light, is given by ~λF,
F
being the ratio number of the focal length to aperture diameter (F=f/D,
with f
being the focal length).
It is a product of angular resolution and focal length: λF=λf/D. Specifically, this is
the limit to resolution for two
point-object images
of near-equal intensity (FIG.
12). Resolution limit can vary significantly
for two point-sources of unequal intensity, as well as with other object
types (FIG. 14-16).
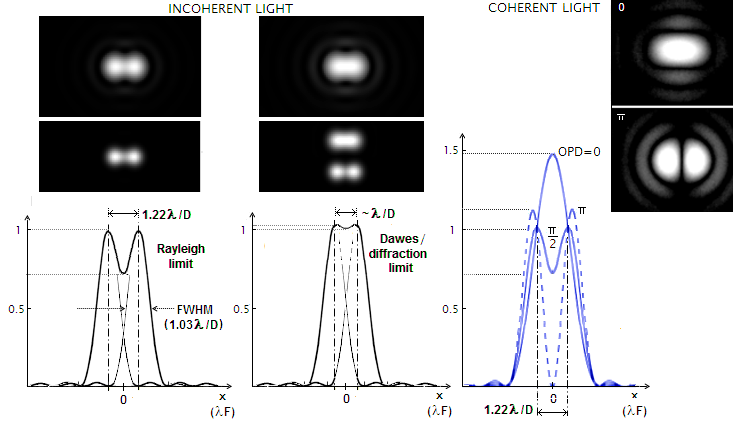
FIGURE 12: LEFT: Diffraction limit to resolution of two point-object
images in incoherent light is approached when the two are of near equal, optimum intensity.
(simulations for incoherent light illustrate difference between a bright and faint pair). As the two
PSF
merge closer, the intensity deep between them diminishes. At the
center separation of half the Airy disc diameter - 1.22λ/D
radians (138/D in arc seconds, for λ=0.55μ and the aperture
diameter D in mm), known as Rayleigh limit
- the deep is at a nearly 3/4 of the peak intensity. Contrast drop between the stars is little over 15%.
Reducing separation
to λ/D (113.4/D in arc seconds for D in mm, or 4.466/D for
D in inches, both for λ=0.55μ) reduces the intensity deep
to less than 2% below
the peak. This is the conventional diffraction
resolution limit for two point sources. It is just below the empirical double
star resolution limit, known as Dawes' limit,
given as 116/Dmm
arc seconds for white stars of
m~5logD-5
visual magnitude for D in mm (m~5logD+2 for D in inches), nearly identical to the Full-Width-at-Half-Maximum, or
FWHM of the PSF, equaling 1.03λ/D. Unlike Raileigh limit, at which
two stars generally will show resolved, Dawes limit requires special conditions (near limit of detection
brightness)
in order to show stars just resolved; most of the time, and all of the time for most observers, there will be
no detectable brightness drop between the stars. With further reduction in separation, the contrast
deep disappears, and two spurious discs merge together. The separation at
which the intensity flattens at the top is called
Sparrow's limit, given by 107/D for D in mm.
RIGHT: Resolution of two
near equally bright stars in coherent light at 1.22λ/D angular separation varies with the OPD between two
point sources. At zero path difference, the two patterns merge
together, forming the central maxima of 1.83λF in radius and 1.47
peak intensity. At π/2 OPD the combined pattern is identical to that in
incoherent light, and at OPD=π the two 1.11 maximas are somewhat more
widely separated, with the intensity deep between them dropping to zero,
the latter two indicating significantly better limiting resolution. Note that for given flux of x waves, individual wave amplitudes A for coherent light are first
added and then squared, as (xA)2,
while squared and then added for incoherent light as xA2,
in order to obtain their combined intensity.
That makes the actual image intensity of
coherent light for given amplitude higher by a factor of x than in
incoherent light, and its change
proportional to x2,
not x.
Peak intensities of the
two point-object images on FIG. 12 remain unchanged at the central
separation of 1.22λ/D, and larger. At smaller separations (inside the
Rayleigh limit), the two peak intensities start to increase, at first
slowly, then rather fast, with the combined intensity doubling as the
two centers merge together.
The combined intensity
of the two patterns (normalized to unit peak intensity) at
any point of their overlap is given by Ic=I1+I2,
with I1
obtained from Eq. (c) for t1=[x-(s/2)]π/2,
and I2 for t2=[x+(s/2)]π/2,
with
x being the point coordinate on the horizontal axis (with zero at
the mid point between two PSF centroids), and s being the
pattern center separation, both in units of λF.
EXAMPLE: For point
separation s=1.22 (Rayleigh limit), t1,2=0.305π
(the sign of t is of no consequence, since it is under even
number exponents), and the combined intensity at the mid point
between two equal intensity patterns Ic=0.7346,
for the first four terms in the series. For one of the peak intensity
points, at x1=-0.61,
t1=-1.22π,
t2=0
and for the other, at x2=0.61,
t1=0
and t2=1.22π,
with the intensity of both remaining 1.
At point separation s=1 (equaling
the approximate
theoretical diffraction limit of resolution for point-sources, given by λ/D in radians),
the combined
intensity at the mid point (x=0, t1,2=π/4)
is 1.042. The two peak intensity points shift closer, away from the original centroids at xc=±0.5,
to x1=-0.32
(t1=-0.41π,
t2=0.09π),
and x2=0.32,
(t1=-0.09π,
t2=0.41π),
with their intensity only slightly higher, at 1.060.
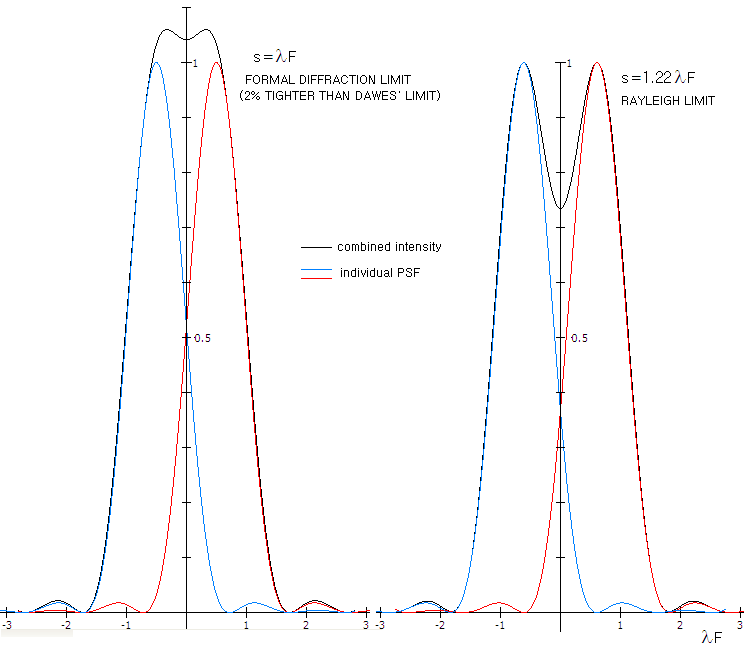
At s=1.02, which is formally given for
the empirical Dawes' limit, the combined intensity at the mid point
(x=0, t1,2=1.02π/4)
is 1.013, with the peak intensity points also shifting closer from
their respective original centroids to x1=-0.4
(t1=-0.455π,
t2=0.055π),
and x2=0.4,
(t1=-0.055π,
t2=0.455π),
reaching 1.045 peak intensity. This implies only 1.5%
contrast, and is considered below detection threshold of
the human eye in field conditions (for ideal conditions, Fechner found that ~1% contrast
treshold applies to a wide variety of objects). Formally acceptable limit for field conditions
varies with the specifics (size, intensity distribution pattern etc.), but generally
should satisfy ~5% minimum
contrast, which would require increase in separation to
s~1.09. In any instance, the difference is small: satisfying
the 5% minimum contrast differential requirement with Dawes' limit
would take as little as reducing 550nm wavelength by ~9%.
The separation at which
the combined PSF flattens at the top occurs at the center separation
107/D in arc seconds, for D in mm (4.2/D for D in inches).
It is so called Sparrow limit,
allowing detection of close doubles based on visual elongation of
the bright central spot of diffraction pattern. For closer separations, peak
intensity of the combined pattern forms at the mid point
between two Gaussian point-object images.
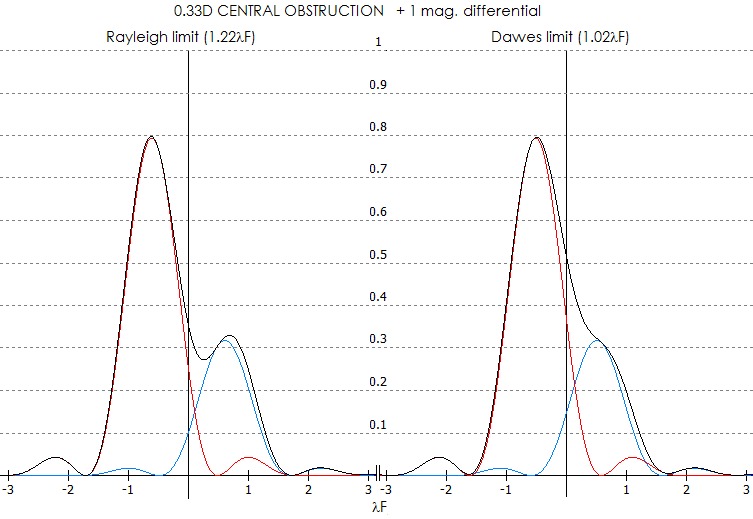
Separation at the resolving limit increases with stars of unequal brightness, the more unequal, the more so.
Below are PSF of two stars with 1 magnitude brightness differential.

At the Rayleigh limit separation, contrast of the fainter vs. brigher star is 43%, and that between
the contrast deep and brighter star 44%. Contrast between the deep and the fainter star is less than 2%,
hence below eye detection threshold. At the Dawes limit separation, there is no contrast drop in between
two stars, and they can only be detected as a double based on deviation from a circular shape.
Also, resolution limit changes for obstructed apertures, due to the central maxima being reduced in size.
For a pair of stars of equal brightness at the Rayleigh limit separation, otherwise perfect aperture with
33% central obstruction (linearly) will have contrast drop of nearly 23% between them, vs. 15% with clear
aperture (below).
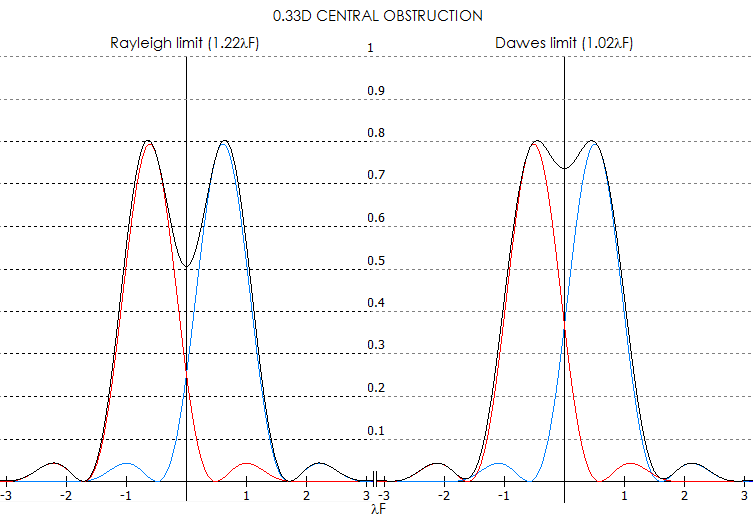
At the Dawes limit separation, contrast drop between two stars is 4.3%, near the detection threshold of ~5%.
This implies that the obstructed aperture has a higher resolution limit, but the difference is very small and
would be hard to detect. Similarly to unobstructed aperture, resolution limit worsens with unequal pairs.
Taking again 1 magnitude brightness differential, a 33% obstructed aperture produces more of a contrast drop
between two stars at the Rayleigh limit separation than clear aperture, but at the Dawes limit separation
contrast drop is still nonexistent. Contrast of the fainter star vs. brighter one is 41%, and that of the
contrast deep between them 49%. Contrast of the deep vs. fainter star is 9%, which implies that it is
visually resolvable.
The PSF plots above are for the nominal (normalized)
intensity. While it is rather common way of illustrating point-source
resolution, the human eye response to light intensity is mainly
logarithmic, hence better illustrated with logarithmic PSF. For
instance, the intensity gap between central peak and second maxima in
aberration-free aperture is 57 to 1, respectively; the eye, however,
sees the peak as less than twice brighter (this applies when both are
well within eye's detection threshold; as the fainter 1st bright ring
nears detection threshold and falls bellow it, the perceived intensity
differential dramatically increases). Graph below (FIG. 13) shows
logarithmic
(log10
)
PSF for polychromatic light (in the range that is 1/10 of
the mean wavelength, inset H),
closer to the PSF of an actual star than monochromatic PSF.

FIGURE 13:
Logarithmic PSF of aberration-free aperture on the (stellar)
magnitude scale shows intensity distribution within stellar image
more closely to that actually perceived by human eye (i.e. the
apparent intensity scales inversely with magnitude). Going from
zero magnitude star to magnitude 15, there is no indication that
visual size of the central maxima differs considerably between bright vs. average and
moderately faint stars (this neglects possible - and probable -
secondary physiological effects on the retina, particularly with
very bright sources). Only as the outskirts of the central maxima
begin to fall below detection threshold, its visible size
diminishes. For the maximum theoretical resolution of two
point-sources, set at λ/D in radians (206,265λ/D in arc seconds),
visible central disc cannot be significantly larger than λ/D
angularly (illustrated for the zero magnitude star, for
convenience). Moderately larger disc still should allow clear
resolution, due to the intensity low forming between two star images,
with the discs likely appearing less than perfectly round. The graph
above implies that it would take place at the detection threshold
approximately two magnitudes below the peak intensity. This is not
far from the reported basis in establishing empirical resolution limit by Rev.
William Rutter Dawes: near equally bright pairs about three
magnitude brighter than the faintest star detectable with the
aperture tested (Sky Catalogue 2000.0, Hirshfeld/Sinnott,
p.xi). According to it, limiting resolution is possible only in the
absence of visible ring structure (typical aberration level, or
average central obstruction, brighten the 1st bright ring less
than a magnitude - as illustrated on
FIG.
95 - which amounts to ~2mm height differential on the above graph).
As mentioned, this
limit applies to near-equally bright, contrasty point-object images at
the optimum intensity level. Resolution limit for star pairs of unequal
brightness, or those significantly above or below the optimum intensity
level is lower. For other image forms, resolution limit also can and
does deviate significantly, both, above and below the conventional
limit. One example is a dark line on light background, whose diffraction
image is defined with the images of the two bright edges enclosing it.
These images are defined with the Edge Spread Function (ESF), whose
configuration differs significantly from the PSF (FIG. 14). With
its intensity drop within the main sequence being, on the other hand,
quite similar to that of the PSF, resolution of this kind of detail is
more likely to be limited by detector sensitivity, than by diffraction
(in the sense that the intensity differential for the mid point between
Gaussian images of the edges vs. intensity peaks, forms a non-zero
contrast differential for any finite edge separation).
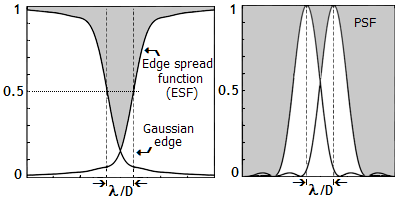
FIGURE 14: Limit to diffraction resolution vary significantly with
the object/detail form. Image of a dark line on bright background is a
conjunction of diffraction images of the two bright edges, described by Edge Spread Function (ESF). As the illustration shows,
the gap between two intensity profiles at
λ/D
separation is much larger for the ESF than PSF
(which is nearly identical to the Line Spread Function, determining the
limiting MTF resolution). It implicates
limiting resolution considerably better than
λ/D,
which agrees with practical observations (Cassini division, Moon rilles,
etc.).
Gradual intensity falloff at the top of the intensity curve around the
edges can produce very subtle low-contrast features, even if the
separation
itself remains invisible.
Diffraction image of a point source on the surface of
most
extended
objects could
be detected only if separated from the rest of surface, not because it
is small and relatively faint, but because it is typically of much lower
intensity than that of the surface. For instance, Jupiter's
total average brightness is as if
it's having a ~6th magnitude star in each square arc second of its surface.
Is 1 square arc second emitting area as a valid point source?
It could be, but it really depends on the aperture size. Diffraction
calculation (Imaging and aberrations 2, Mahajan) shows that the
light-emitting incoherent disc - or a hole - smaller than ~1/4 of the
Airy disc, produces PSF no appreciably different than that of a perfect
point source (FIG. 14). With the angular Airy disc diameter
given by 2.44λ/D in radians
(multiplied by 206,265 for arc seconds), that sets the maximum disc
(hole) diameter that qualifies as a point-source at ~0.6λ/D,
or smaller, in radians, ~125,000λ/D,
or smaller, in arc seconds (the corresponding linear size is directly
determined by its distance, as a product of the distance and its angular
size in radians).
Consequently, diffraction image of an extended
surface can be evaluated as a product of surface dots not larger than
1/4 of the Airy disc diameter (further division of this effective
point-source at given surface luminance merely diminishes the actual PSF
maxima of such surface unit, but its spatial characteristics do not
change appreciably vs. that for 1/4 Airy disc dot, nor the PSF volume
integrated over 1/4 Airy disc dot area does differ appreciably from one
produced by such dot). In terms of square arc seconds, the area
corresponding to 125,000λ/D
diameter dot is for the square side smaller by a factor of π/4,
thus given by 99,000λ/D. For λ=0.00055mm
(photopic peak), that would give 0.54 square arc second (i.e. square
with a 0.54 arc second side) for 100mm aperture, 0.27
arc seconds for 200mm, and so
on.
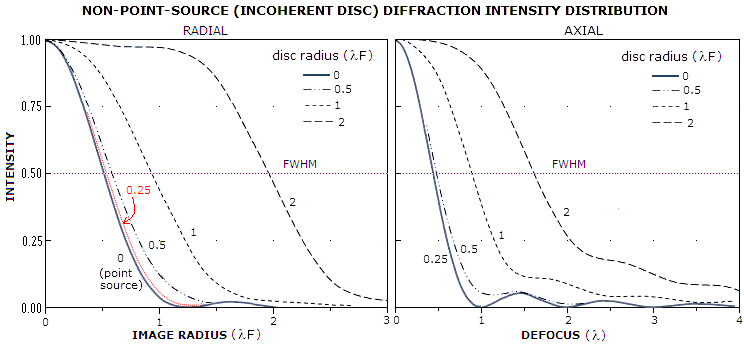
FIGURE 15: An object does not have to be
strictly a point-source in order to produce point-source PSF, but if its
angular dimensions exceed certain level, its central diffraction maxima
widens, and it transforms into an image of extended object.
LEFT: Change
in the radial intensity distribution as emitting area increases from
zero (point-source) to a disc 2λF in radius. At the disc radius equaling
λF/4, or 1/5
of the Airy disc radius, resulting PSF is only slightly wider than that of a
point-source, hence a circular emitting area of that size, or smaller,
can be considered a point-source with respect to its diffraction image.
RIGHT: Change in the central intensity with the increase in axial
defocus. The larger disc radius, the less sensitive to defocus is the
central intensity of its image. While it drops to zero already at 1 wave
defocus for a disc (hole) radius equaling
λF/4, it
remains above zero beyond 4 wave defocus already at a disc radius
equaling λF,
slightly smaller than the Airy disc's. Note that central intensities on both graphs are
all normalized to 1, but the actual peak intensity vary with the disc
size. With constant disc's surface luminance, the actual
diffraction peaks for 0.25, 0.5, 1 and 2 radii, normalized to the
highest, would relate as 0.15, 0.88, 0.97 and 1, respectively.
Unlike point-source diffraction image, where there is
no appreciable difference in the shape of normalized PSF for coherent
and incoherent light, an extended object image in coherent light
develops isolated peaks over its central maxima, the strongest being at
its edge. This results in the effect called "edge ringing", making
integrity of the image inferior to that in incoherent light.
Surface of an extended object can be decomposed on point-sources,
that overlap and grow into a larger diffraction image of it. Any
distinctive area on such surface also can be decomposed on its effective
point-sources. Whether such an area - a surface detail - will be visible
in the telescope image depends on the multiple factors: its size,
brightness and contrast and, if colors are present, hue specificity and
saturation.
Of course, optical aberrations can also have
significant effect on the intensity distribution, image vs. object,
scattering energy and lowering contrast/resolution. While aberrations
here do cause the same general effect, the specifics are different than
those for point-source (FIG. 16).
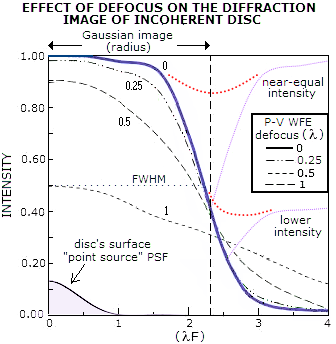
FIGURE 16: Radial intensity distribution within diffraction
image of incoherent disc, with the radius 2.3 times the Airy disc
radius with zero defocus (solid black) and specified amounts of the
aberration. As much as 1/4 wave P-V of defocus has negligible effect
on both, central intensity, and energy lost to the central maxima,
and as much as 1/2 wave only lowers this maxima's central intensity
to 0.91. One wave of defocus, which brings central intensity of the
PSF to zero, is still just below 0.5 here. However, the numerical
value of central intensity here does not have the same implications
as with the PSF. While in the latter it closely approximates the
relative energy preserved in the maxima - hence directly implying
the relative energy loss - here it is generally optimistic in that
respect. The reason is the different manner with which the
aberration affects the shape of central maxima: since its energy is
proportional to its volume, the reshaped aberrated volume which,
unlike PSF maxima, loses relatively more energy off the sides than
off the top of the aberrated central maxima, causes significant disparity
between the relative nominal drop in central maxima and the relative
loss of energy. In general, the latter is significantly higher. So,
for instance, while the drop in central maxima for 1/4 and 1/2 wave
P-V of defocus is 2% and 9%, the corresponding loss of energy is -
very roughly - closer to 10% and 30%, respectively. At the same
time, change in the relative size of FWHM for these error levels, similarly to
PSF, remains insignificant.
If the effect of aberrations on
the diffraction image of an extended object is so much smaller, how do aberrations in this
range, quite common in telescopes, inflict noticeable loss to the contrast of extended detail?
Well, they don't; not at this detail size level. With the Gaussian image
radius of 2.3λF,
this disc is nearly 4.5 times wider than the MTF cutoff frequency (1.03λF),
which puts the corresponding normalized MTF frequency at 0.22. Thus it is
in the low-frequency domain where the contrast drop caused by aberrations is
generally lower (FIG. 17).
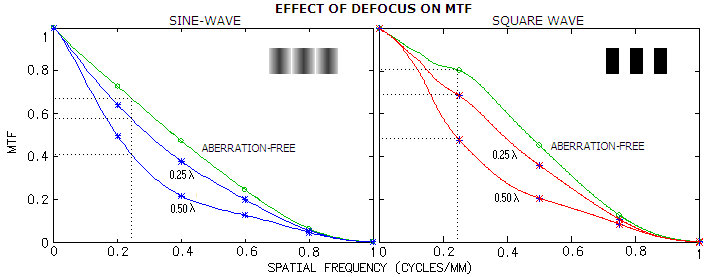
FIGURE 17: Polychromatic (photopic) MTF
plots at left showing effect of defocus on contrast transfer and,
for comparison, their effect on CTF
(right). The sine-wave
(standard) MTF has generally lower contrast transfer than
square-wave CTF, with defocus
in the former lowering contrast vs. aberration-free image at 0.22 frequency 14%
at 1/4 wave
P-V, and 39% at 1/2 wave. That compares to 19% and 56% contrast loss,
respectively, averaged over full range of frequencies. With the square-wave
CTF,
the corresponding contrast loss is 14% and 40%, respectively.
Both MTF and CTF give contrast loss at this detail
size greater than the rough estimate of the energy/contrast loss based on
radial energy distribution. The difference is relatively modest at 1/4
wave of defocus, 14% vs. ~10%, and more ambivalent at 1/2 wave: 56% and
40% vs. ~30% for the MTF and CTF, respectively. But it
is to expect, since neither is directly comparable in the form to a
coherent disc (at 1/2 wave defocus error, the contrast transfer
difference between the two is even slightly greater than between the CTF and the disc).
And neither of the two MTFs nor, for that matter,
incoherent disc on dark background, are a detail form similar to, say,
typical planetary detail. Such detail is imbedded into surrounding of
adjacent details of similar intensity. The level of its detection
depends as much - if not more - on color distinction, as on intensity
differential (contrast). The color factor is entirely neglected by MTF.
If two objects of the same intensity are placed in contact with each
other, their image will show a continuous, single surface, simply
because there is no discontinuity in wave emission. But if these
surfaces emit at different principal wavelengths, the eye will create
distinction by assigning to them different colors. In other words, color
produces contrast-like quality, which can enhance detection/resolution
for any level of image-inherent contrast, including zero.
If we, however, assume that such extended details are
not seamlessly bonded to their surroundings, and/or vary in their
relative intensities - the more likely scenario - then there is wave
emission discontinuity between them, and their diffraction images, at
least in first approximation, superimpose forming the complex final
image. Between two very close details of similar intensity - as
illustrated on FIG. 10C top right, the combined energy will
likely fill out most of the gap between their respective individual
images, leaving only a narrow, very low-contrast transition area,
unlikely to be detected. Detection of such details would depend entirely
on their color distinction; the lower it is, the sooner it will be
affected by aberration-caused spread of energy, but the degree to which
it will be affected also critically depends on detail's angular size.
If detail's relative intensity is significantly
different, contrast also becomes significant factor (FIG. 10C,
bottom right). Such details are more typical of the Moon surface. Due to
their relatively high contrast level, they will be less affected by the
aberrated energy spilling over. Again, their angular size is the major
determinant of the effect of any given aberration level on their
detection.
This, obviously, only scratches the surface of the
relation between image quality of extended details and aberrations. But
this very basic concept does shed more light on this fairly obscured
subject. In general, larger aperture will resolve more,
because its effective point-source (which can be also seen as image
pixel) is, as mentioned, inversely proportional to the aperture
size. Also, it will have better color saturation. The brightness factor
is somewhat ambivalent, since it can be both, beneficial and
detrimental. It is generally beneficial in detection of point-sources
and alike, as well as faint objects of all types. It can be
disadvantageous for resolution of bright point-like and extended
objects' details. However, since telescope light transmission can be
easily lowered at any given aperture, that detriment is of rather formal
nature.
Generally, the size of smallest detectable detail on
the surface of an extended object is roughly proportional to the telescope's
nominal (point-object) diffraction resolution limit and light gathering
power, but it is also significantly lower, varying with the detail type
and surrounding. For the typical bright
low-contrast details (major planets), and dim low-contrast details (most
nebulas and galaxies), the MTF analysis by
Rutten and Venrooij (Telescope Optics, p215) indicates
the MTF resolution limit lower approximately by a factor of ~2 and ~7,
respectively, than for bright, contrasty
pattern (which is practically identical to the telescope's nominal stellar resolution limit).
Formal premises and experimental results on
the subject of telescope resolution
are covered in detail in Amateur Astronomer's Handbook, J.B. Sidgwick (p37-51). Naturally, resolution in general
will deteriorate with introduction of wavefront aberrations.
◄
2.1. Light-gathering power
▐
2.3. Telescope magnification
►
Home
|
Comments |