|
telescopeѲptics.net
▪
▪
▪
▪
▪▪▪▪
▪
▪
▪
▪
▪
▪
▪
▪
▪ CONTENTS
◄
7.1.1. Inconsistencies in the
theoretical concept?
▐
7.2. Spider obstruction
► 7.1.2. TELESCOPE CENTRAL OBSTRUCTION: SIZE CRITERIA
PAGE HIGHLIGHTS Since the negative effect of CO is so similar to that of wavefront aberrations, the question of what is its maximum acceptable size can be answered in terms of the conventional aberration limit of 0.80 Strehl. The following answers this question approximately for the range of resolvable low-contrast MTF frequencies (approximately the left half of MTF graph), usually one that is of greatest interest.
Setting I=0.80 puts
the maximum acceptable CO size at ~0.32D according to
Eq. 61, and at ~0.35D according to
Eq. 61.1. However, it assumes perfect
optics. For an actual optical set of the Strehl ratio S higher
than 0.80, the minimum acceptable obstruction size for the combined ~0.80
Strehl level for low-to-mid MTF frequencies would be obtained from SI=0.80, with the peak intensity factor
for the obstruction, as mentioned, I=(1-ο2)2=1-2ο2+ο4.
In this concept, linear obstruction has to be smaller than 0.35D, so the
ο4 factor can be neglected, and the maximum acceptable
CO size for the combined ~0.80 Strehl level is: οmax~[0.5-(0.4/S)]1/2 or, adjusted for better contrast transfer due to the smaller pattern,
οmax~[0.6-(0.48/S)]1/2 (62)
with ο
being, as before, the relative obstruction diameter in units of the
aperture.
For the entire range of MTF
frequencies, οmax~[1-(0.80/S)]1/2. Following table gives
the corresponding c.obstruction sizes for selected optics Strehl
values (in units of the aperture diameter). OPTICS
STREHL ► 1 0.95 0.90 0.85 0.80 MAX.
C.OBSTRUCTION (ο)
FOR mid-to-low MTF
frequencies unadjusted 0.32 0.28 0.24 0.17 0 adjusted 0.35 0.31 0.26 0.19 0 entire range of
MTF frequencies 0.45 0.40 0.33 0.24 0
More exact calculation would take into account that the RMS
wavefront error - hence the resulting Strehl ratio - would likely
change due to the presence of obstruction. The RMS wavefront error
change can be for the better, or for the worse, depending on
the contribution of the obscured central part of the wavefront to
its average deviation. The problem is that often it is not known
which specific aberrations are inherent to the optics, or it is a
mixture of multiple aberrations, including various forms of random
surface deformations. In general, central obstruction will reduce
aberrations causing significant wavefront deformation over the
inner pupil portion. And vice versa, it will
worsen those causing only insignificant wavefront deviations over
the inner pupil area.
Inset below addresses
effect of central obstruction on wavefront aberrations in
more detail.
RMS wavefront error at the best focus location is affected by
central obstruction as given by these relations:
- primary spherical aberration (best
focus):
ωo = ω(1-ο2)2
where
The corresponding graph, at left (for unit aberration in clear
aperture), shows that central obstruction consistently (i.e. for
any obstruction size) reduces primary spherical aberration and defocus.
It slightly worsens primary coma up to about 0.4D CO, but it is quickly
reversed to the reduction in aberration for larger obstructions. In
general, the effect increases progressively with the obstruction size.
The only primary aberration worsened by any obstruction size is
astigmatism. However, the effect may become significant only at
obstruction sizes larger than 0.5D. The benefit of reducing defocus and
spherical aberration is more than offsetting slight worsening in coma
and astigmatism. This is particularly the case with spherical
aberration, which can be significantly reduced already at the obstruction
sizes of ~D/3. Plots at left show how the shape of wavefront deformation
at the best focus spherical aberration change with the size of central
obstruction. With the defocus to location of minimum wavefront deviation
in the presence of central obstruction larger by a factor of (1+o2)
than in circular aperture, wavefront profile at this location is given by ρ4-(1+o2)ρ2,
where ρ is the height in pupil normalized to 1 for pupil radius.
Setting first derivative of it, 4ρ3-2(1+o2)ρ,
to zero, and solving for ρ, gives the zonal height of the
deflection zone ρ
Although both, the relation and graph indicate that astigmatism becomes
progressively larger with increase in central obstruction,
becoming larger by
a factor 3
Note that these RMS values are with respect to a new reference sphere,
best fitted to the portion of wavefront within annulus area. This
reference sphere is of slightly shorter radius with under-correction,
opposite with over-correction (the effective P-V error also changes, but
it is the RMS error change that affects image quality). The combined
peak diffraction intensity in the presence of aberrations is given by a
product of the peak diffraction intensity of aberration-free obstructed
aperture, and that corresponding to the RMS wavefront error
ω over annulus area, in units of the wavelength, or:
e being, as before, the natural
logarithm base e~2.72. Thus, for
instance, a system with 0.37D c. obstruction and 0.074 waves RMS of
spherical aberration (0.25 wave P-V) over full surface area of its
optics, has the RMS error within annulus reduced to 0.055 waves RMS, resulting
in the combined peak intensity of
0.66. That is better than 0.60 peak intensity that would
result from using the unadjusted wavefront RMS.
In effect, in the presence of spherical
aberration, CO partly compensates for its damaging effect by reducing
the wavefront error. When both CO and the inherent wavefront error are large
enough, obstructed system can even perform better. For instance, a
system with 1/2 wave P-V of lower-order spherical aberration performs
slightly better with 50% obstruction than without it (peak diffraction intensity
0.426 vs. 0.395, respectively).
Evidently, these factors may have
importance with larger obstruction sizes and wavefront error
levels at which the relative change induced by obstruction has
appreciable effect (i.e. not too small, and not to large aberration).
In addition to spherical aberration, the effect on defocus
error also can be significant, a consequence
of the axial elongation of the central maxima in the presence of obstruction. It makes an
aberration-free obstructed telescope
less sensitive to defocus by a
With aberration significantly exceeding 1/2 wave P-V at
the best focus, there is a shift of diffraction
focus (i.e. PSF maxima) away from the point of minimum wavefront
deviation. It is a consequence of the RMS wavefront error and Strehl
ratio being not directly related with large, as they are for small
aberrations. Since the above considerations assume focus location with
the minimum wavefront error (mid focus), they are valid only for the
aberration levels not exceeding 0.15 wave RMS. Plots at left represent
change in the longitudinal (along axis) intensity distribution for a system with
50% linear obstruction (o=0.5) and increasing level of primary
spherical aberration. The PSF is normalized to unity for zero
spherical aberration.
The question of the CO
size at which its effect becomes insignificant can be answered in a
similar manner as for its maximum tolerable size. For perfect optics, with S=1, it is determined by any chosen Strehl figure SN considered to
be the level of negligible image deterioration. Since here SI=SN=I=(1-ο2)2,
οmax~(0.5-0.5SN)1/2
or
οmax~(0.6-0.6SN)1/2 (64)
the latter
adjusted for the better contrast transfer efficiency. So, if the desired
effective Strehl for resolvable low-contrast details is SN=0.9, the
corresponding maximum c. obstruction size (adjusted for better contrast
transfer) with aberration-free aperture is οmax=0.24.
For imperfect optics, with the
Strehl S<1, but presumably better than S*, it would be determined from
also adjusted for better contrast transfer efficiency.
If, for instance, the optics Strehl is S=0.95, and the desired Strehl
level for resolvable low-contrast details is SN=0.9, the corresponding
c. obstruction size is οmax=0.18
(also adjusted for better contrast transfer due to its relatively
brighter central maxima vs. that in aberrated aperture). And for an
aberrated optics set with S<SN, valid criterion would be how much of an
additional contrast loss of extended details τE, expressed as a ratio number, is found to be either
negligible or acceptable. According to it,
Taking 5% additional average contrast
loss (τE=0.05) on low-contrast details as a reasonable level of hard to
notice contrast change, we arrive at the size of obstruction likely to
produce negligible effect for most people as
ο~0.17
of the aperture diameter. Of course, this applies as well to
aberration-free apertures.
As mentioned, the above consideration is for the left side of
the MTF graph, i.e. resolvable low-contrast details. For the entire
range of MTF frequencies, the tolerable size of CO
is significantly larger, as obtained by replacing (1-ο2)2
factor by (1-ο2).
In terms of the additional general contrast loss τG,
over the entire range of MTF frequencies, the corresponding relative obstruction size is given by:
ο
Thus, while the CO size producing ~20% contrast loss for extended
details (τE)
is 0.35D, it is as much as 0.45D for the identical drop in general
contrast level TG.
However, practical importance of the right half of MTF graph for
general observing is considerably less than 50%; it mainly limits to
splitting near-equal in brightness double stars, and resolving
high-contrast line-like features near or beyond diffraction limit
(Cassini division, Moon rills). Consequently, extended-detail
contrast transfer τE
is more relevant indicator of the overall performance level of an
obstructed aperture.
More detailed insight into the change
of intensity distribution and contrast loss caused by CO is given by the
PSF and
MTF, respectively
(FIG. 106).
retained small but consistent advantage in image definition. The apparent
size of Jupiter is about 3 Note that seeing error, whose averaged magnitude is in proportion to (D1/D2)5/6 will worsen the actual field performance of a larger (obstructed) relative to that of the smaller aperture. Obviously, in the actual field conditions, that will lower somewhat the overall contrast level in the larger (obstructed) aperture, widening its limiting resolution gap vs. perfect aperture. However, since smaller aperture also suffers from seeing error, although smaller in magnitude, there is no significant change in their relative contrast transfers (FIG. 107, left). The effect of c. obstruction on contrast and resolution also vary somewhat with the aperture size (FIG. 107, right).
Note that nearly identical
contrast/resolution level in the larger vs. smaller aperture for the
averaged seeing error does not imply that the two will offer similar
level of performance. Seeing error constantly varies around its average
value and, in general, error reduction by any given ratio - it is
commonly up to 50%, sometimes more, within short periods of time - benefits larger aperture more. On
the other hand, larger aperture has generally more significant other
error sources (thermals, collimation, optical quality), so the actual
score is determined as a break-down between the magnitude of the
residual advantage of the larger aperture, when it is optically perfect,
and the level of its optical errors not related to seeing. ◄ 7.1.1. Inconsistencies in the theoretical concept? ▐ 7.2. Spider obstruction ►
|
||||||||||||||||||||||||||||||||||||||||||||||||||||||||||||||||||||
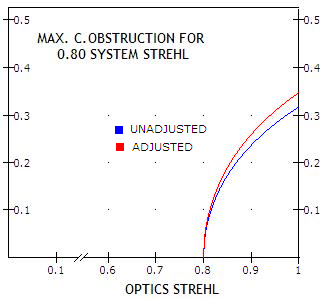
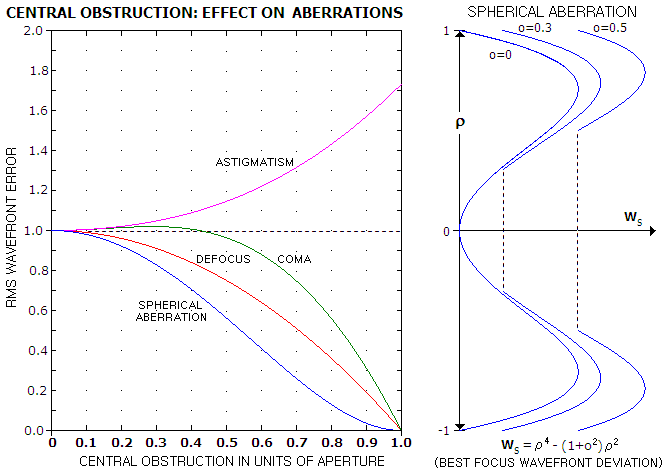
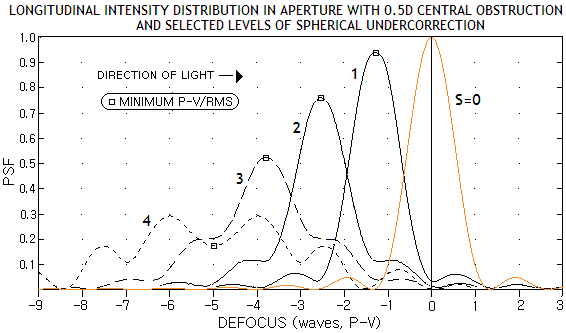
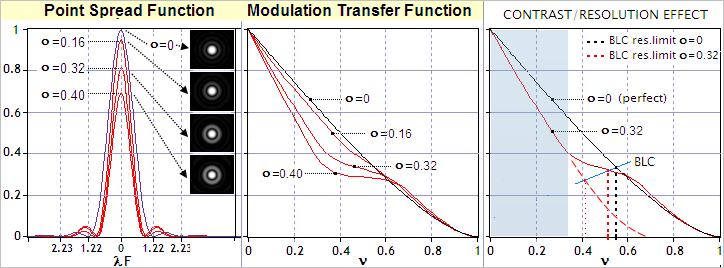 FIGURE 106:
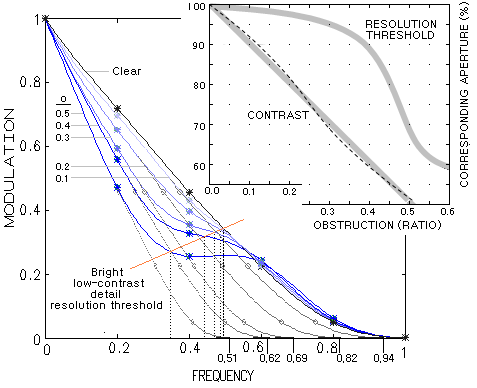 these two
MTF parameters for the range of
ο
values, but MTF data can be used to interpolate the corresponding
graphs.
these two
MTF parameters for the range of
ο
values, but MTF data can be used to interpolate the corresponding
graphs.
