|
telescopeѲptics.net
▪
▪
▪
▪
▪▪▪▪
▪
▪
▪
▪
▪
▪
▪
▪
▪ CONTENTS ◄ 5.1.1.1. Seeing and aperture ▐ 5.2. Low-level turbulence, tube currents... ► 5.1.2. seeing error: limiting resolution, Strehl, otf Due to the random nature of seeing-induced error, the Strehl approximation for non-random aberrations, given by Eq. 56 becomes inaccurate for larger errors, considerably more than it is for conventional aberrations (FIG. 97). The effect could be mainly due to the roughness error component, whose increase reduces the average relative size of wavefront irregularity, while at the same time increasing its average RMS error. Similarly to ordinary surface roughness, narrow zones and turned edge, the increase in the P-V (and thus RMS) error after a certain point begins to drain less energy out of the Airy disc, with the main effect gradually becoming merely spreading the energy out wider. As a result, the increase in the RMS (surface or wavefront) error is followed by a relatively slower Strehl degradation, as given by the relation derived by Racine (The Telescopic Point-Spread Function, 1996; its general form is given on FIG. 83):
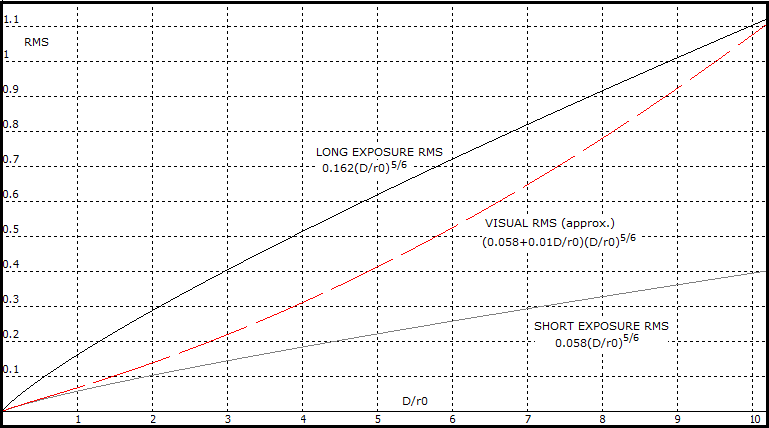
e being the natural logarithm base (e~2.718, rounded off to three decimals) and φ2 the variance over the pupil. For long-exposure, φ2=1.03(D/r0)5/3, and for short exposure φ2=0.132(D/r0)5/3 (note that the constant value here is slightly different than 0.134 with Mahajan). Variance is directly related to the standard deviation, i.e. the RMS error. If φ2=(2πφL)2 is the phase variance across the pupil, then φL=0.162(D/r0)5/6 amounts to the time-averaged (long-exposure, defined as an exposure significantly longer than the coherence time) RMS wavefront error induced by seeing (Eq. 52.1). So, for D/r0=1, the average RMS wavefront error φL=0.162, giving φ2=1.03, and the seeing Strehl S=0.445; for the nominally identical linear RMS wavefront error ω of non-random aberrations the Strehl (from Mahajan's approximation) is 0.357.
For
short exposure (at the level of coherence time, or shorter), the
corresponding RMS wavefront error is
φL=0.0582(D/r0)5/6
(Eq. 52.2).
A simpler long-exposure Strehl approximation, for
(D/r0)~1
and larger,
is S~1/[1+1.23(D/r0)2],
and even simpler, for (D/r0)
values over 5, is S~1/(D/r0)2.
A quick long exposure seeing Strehl approximation,
empirically fitted for (D/r0)
around 1 and smaller is S~1-0.55(D/r0).
The exact Strehl values from the Racine's paper are given in the
following table. SEEING STREHL
RATIOS FOR LONG (SL) AND SHORT EXPOSURES
(SS) D/r0 SL SS SS/SL 0.0 1.000 1.000 1.00 0.1 0.978 0.997 1.02 0.5 0.741 0.948 1.28 1 0.445 0.844 1.90 2 0.175 0.594 3.38 3 0.089 0.369 4.17 3.5 0.067 0.285 4.23 4 0.053 0.218 4.10 5 0.035 0.128 3.64 7 0.019 0.051 2.76 10 0.009 0.021 2.18
Note that the calculations are based on the standard Kolmogorov
turbulence model, which assumes an infinite outer scale of
turbulence. While the paper claims good agreement with experimental
data, it is to expect that these numbers are generally somewhat
pessimistic, due to the error
reduction resulting from the finite outer scale of turbulence in
the actual field condition.
Due to increase of the effect
of the tilt error component in visual observing, either with the
increase in aperture (for given seeing level), or in the seeing error
(for given aperture), the resulting visual Strehl
gradually shifts from being near identical to the short-exposure Strehl
(for D/r0~1, or
smaller, such as in very small apertures in the average or better
seeing, or small-to-medium apertures in exceptionally good seeing), to be closer to the long-exposure Strehl
(for D/r0~5
and larger seeing
errors).
The rate of gradual incerase in the proportion of tilt error in the
total error is unknown, at least I'm not aware of any theoretical,
or practical concept of it. Nominally, it would represent a gradual
increase from the RMS error for wavefront roughness alone
(short-exposure error), RMS(r)=0.058(D/r Plot on
FIG. 83 illustrates basic relations between the three
main forms of seeing-induced error: long
exposure, short exposure and visual.
Standard approach to
the seeing error is for long-exposure.
In it, the size of r0
determines angular resolution of large telescopes as α~λ/r0
in radians, or α~206,265λ/r0
in arc seconds (λ
being the wavelength of light), as opposed to the "standardized"
diffraction resolution given by ~λ/D.
While the size of r0
results from a complex function, it can be expressed much more simply in
terms of the resolution limit it imposes to large telescopes. For
seeing imposed stellar resolution α
in radians, and wavelength λ, it is approximated by:
r0
~ λ/α (54)
Hence, an average ~2 arc
second seeing at the zenith, for λ=0.00055mm,
results from r0~57mm
(2 arc seconds in radians is 2/206,265). Note that the averaged
turbulence limited stellar resolution is often cited as somewhat
inferior to the above: α~1.2λ/r0,
or α~1.27λ/r0
(Schroeder). Obviously, if these are
taken to represent seeing, the value of r0
corresponding to the given nominal seeing figure will be proportionally
larger as well.
Since r0
is
changing in proportion to λ1.2
and (cosγ)0.6,
γ
being the zenith angle in degrees, a more complete expression for its size is
given by:
Thus, the extracted limiting stellar resolution
is:
where r0
is the atmospheric coherence length for λ=0.00055mm corresponding to the zenith
angle γ.
So, for instance, at 30° from zenith (γ=30°)
and the wavelength λ=0.0005mm, atmospheric coherence length r0=100mm
for 0.00055mm wavelength results in r0'=(0.0005/0.00055)1.2(cos30)0.6=0.77r0=77mm
coherence length for 0.0005mm wavelength. The corresponding limiting stellar resolution ("seeing")
at this wavelength is α'~0.0005/77
radians, or 1.34 arc seconds (after multiplying by 206,265).
Following table gives rounded off values of
long-exposure r0 and
α
in 2 arc seconds seeing for
several values of zenith angle γ, for
λ=0.00055mm. Values are calculated based on seeing-limited resolution
given as
α~λ/r0
in radians (α~206,265λ/r0
arc seconds); for seeing limited resolution given as
α~1.2λ/r0
or
α~1.27λ/r0,
the atmospheric coherence length is larger by a factor equal to the
numerical constant. Zenith angle γ
(degrees) 0 15 30 45 60 75 Atmospheric
coherence length
r0
(mm) 57 55 50 40 29 15 Limiting stellar
resolution
α (arc
seconds) 2 2.1 2.3 2.8 4 7.7
For small amateur telescopes over 60mm in aperture diameter, limiting
visual stellar resolution for these
r0 values will be generally better due to significantly smaller
seeing-induced error level.
Linear long-exposure seeing diameter - an aspect of seeing-limited telescope resolution
that can be important in imaging applications - is FWHML=αf=λf/r0=(D/r0)λF,
with f being the system
focal length.
In the average 2 arc seconds seeing, with r0~57mm,
a 300mm aperture with (D/r0)
of ~5, the average long-exposure seeing FWHM diameter is about 5λF linearly,
twice the Airy disc size, and larger than
system's aberration-free FWHM (~λF) by a 1.2 D/r0
factor or, in this case, five times.
For short exposures (generally
less than 1/20 of a second, specifically at the level of the
coherence time, or smaller), the speckle movement caused
by wavefront tilt error ceases, and both seeing blur and its FWHM
shrink. If, for the
purpose of obtaining a general idea of short-exposure FWHM, the tilt-component RMS wavefront error - from
Eq. 52.1-2, rounded to 0.1(D/r0)5/6,
in units of the wavelength - is assumed to be ~1/3 of the averaged P-V tilt
error W on the wavefront, averaged angular displacement of
the speckle structure due to wavefront tilt error is αt~Wλ/D~0.3(D/r0)5/6λ/D
in radians.
The corresponding average linear displacement from the center in the image plane is αtf,
f being the focal length, or
0.3(D/r0)5/6λF.
In other words, for given r0,
nominal angular tilt error decreases relatively slowly - in
proportion to D5/6/D=1/D1/6
- with the increase in aperture, but effectively increases relative
to the angular size of diffraction pattern, in proportion to D/D1/6.
For instance, nominal angular motion of the image will be
about 32% smaller in 100cm compared to 10cm aperture, but in terms
of the ten times smaller angular pattern of the former, it will be
6.8 times larger. Nominal linear motion for given λF is proportional
to (D/r0)5/6.
or, for given r0,
in proportion to D5/6.
Accordingly, linear diameter of the
short-exposure FWHM is approximated by deducting 0.6(D/r0)5/6λ
from long-exposure FWHM, i.e. FWHMS~(D/r0)λF-0.6(D/r0)5/6λF.
Alternately, it is smaller than long-exposure FWHM by a factor 1-[0.3(D/r0)5/6/0.5(D/r0)]=1-0.6(D/r0)-1/6.
This is only a crude approximation, producing FWHMS
value for D/r0=1
well below λF - in part due to
FWHML~(D/r0)λF
underestimating FWHML
value for D/r0
close to 1 - but it does indicate two important features of the
seeing FWHM:
(1) short-exposure FWHM is nearly
identical to the aberration-free FWHM for the low single-digit D/r0
values, and
(2) relative long-exposure enlargement
of the short-exposure FWHM diminishes with D/r0
increase.
The variance of the image motion is given by Tyler as
φ02=0.34(λ/r0)2(D/r0)-1/3
arcsec2,
or as standard (RMS) deviation
φ0=0.58(λ/r0)(D/r0)-1/6
arc seconds, where λ/r0
is the long-exposure seeing in radians (206,265λ/r0
in arc seconds). Gaussian approximation
of the intensity distribution within the image (atmospheric PSF) is
given by I~exp-0.5(θ0/φ0)2.
Following graph (based on Hardy, 1998) shows the actual relationship
between long-exposure and short-exposure FWHM angular size, both
normalized to λ/r0,
as a function of D/r0.
Thus, the diffraction-limited plot (blue) shows the size of
diffraction-limited FWHM (~λ/D)
in units of λ/r0;
since r0~D/x,
x being the numerical value for D/r0, λ/r0~xλ/D.
FIGURE 84:
The plots are showing that the seeing FWHM is significantly smaller
for short vs. long exposure. The difference is largest at
The relative image motion plot shows already mentioned tendency of
subsiding with larger D/r0
values. However, it diminishes only in terms of λ/r0.
The relative amplitude of image motion, in units of the actual FWHM, λ/D,
steadily increases, from about 1 at
D/r0=1
to about 8 at
D/r0=10,
and nearly in proportion to the change in D/r0
for its larger values. It is mainly caused by the increase in the
tilt error component. The increased amplitude of image motion causes
increased blurring of the visual image, as perceived by the
eye.
Graph below shows how the averaged intensity distribution
(PSF) for
long and short exposure seeing
PSF deteriorate with the increase in seeing error.
With long exposure, ring structure is already lost at (D/r0)=1.
The plot asymptotically approaches horizontal axis, thus can be
approximated with simple Gaussian functions for any D/r0
value.
After relatively small initial FWHM increase for
(D/r0)~1
or smaller,
its diameter further increases approximately by
a factor of 1+(D/r0)λF,
for (D/r0)
values up to 10, and beyond.
Energy encircled within FWHM slowly diminishes from 50% of the total
energy at (D/r0)=0
to 40% at (D/r0)=5.
Loss of FWHM energy is less of a factor than its enlargement:
at (D/r0)=5
the FWHM diameter is ten times larger than in aberration-free
aperture. This results in as much inferior limiting stellar
resolution. For unobstructed aberration-free aperture, radius of the
80% energy circle ranges from 0.9λF
for
(D/r0)=0
to 5.6λF for
(D/r0)=5.
EFFECT OF CENTRAL OBSTRUCTION
Aberration-free aperture with D/2
central obstruction diameter is
clearly inferior at
(D/r0)=0,
with the 80% energy radius of 1.9λF;
as seeing error increases, the difference in the circle radius vs.
unobstructed aperture diminishes, nearly disappearing at
(D/r0)~5
and larger.
Numerical aspect of the changes in FWHM and EE are given in table below. * estimate based on
projecting plots beyond (D/r0)=3 in Optical Imaging and Aberrations 2,
Mahajan (p418)
Consistent with its general effect, presence of
central obstruction causes shift of energy outside of central
maxima. Expectedly, the effect on PSF and encircled energy generally
diminishes with the increase in seeing error (FIG. 86). In
part, it is due to the long-exposure Strehl - the measure of
wavefront quality, independent of the effect of central obstruction
- becoming higher for the obstructed aperture as the size of
obstruction and D/r0
ratio increase. The effect of obstruction on the Strehl is nearly
neutral at (D/r0)~3,
negative for smaller, and positive for larger ones. While seemingly
contradictory, it could be rationalized by the aberration
contribution from the area blocked by obstruction changing vs. that
of the annulus area for with the change in
(D/r0).
For the lower values, i.e. for coherence length larger relative to
the aperture, pupil area blocked by obstruction tends to have lower
than average wavefront error, thus the annulus alone has it higher.
For the smaller relative coherence lengths, however, pupil area
blocked by obstruction begins to contribute more to the overall
error (in unobstructed aperture), while the narrower annulus has
more of the effect analogous to that of aperture reduction.
Short exposure PSF shows no significant FWHM increase even at
(D/r0)=5;
its intensity distribution retains some form of secondary maxima
well beyond this
D/r0
value. Its relative intensity of about 0.3 peak intensity means that
it appears nearly half as bright to the eye. Since this intensity
distribution is a product of significant wavefront roughness, the
ring structure is broken into randomly moving segments, already
resembling speckle structure.
In general, for achieving near-limiting resolution and contrast,
pixel size shouldn't be larger than FWHM/2. This relative pixel size
preserves limit to resolution set by FWHM, with
pixel contrast transfer being only
moderately lowered. For maximizing limiting
magnitude, however, it should be somewhat larger than FWHM. A
compromise pixel size is in between, depending on which of the two
aspects is more important.
Even with pixel size optimized for
contrast (i.e. not significantly larger than one half of the seeing
FWHM), contrast transfer will be lowered due to the spread of energy
caused by seeing error - the larger error, the more so.
A fairly popular concept in imaging is the probability of
"lucky exposure", defined as a very
short exposure (less than half coherence time) capturing moment of
diffraction limited seeing, or better. Diffraction-limited is
defined as 1 radian2
RMS phase variance, or less, which corresponds to 1/2π
RMS, or less. For instantaneous exposure, this error level
corresponds to (D/r0)~3.4.
The original Fried's paper gives the following probabilities (P)
for selected D/r0
values:
The paper also gives a fitted equation approximating P
(whose exact value is given by a complex integral) as
P~5.6exp[-0.1557(D/r0)2],
where exp stands for the natural logarithm base e~2.72 under
the exponent in brackets. It becomes progressively too optimistic
for D/r0~6
and smaller, coming to P=1 for D/r0~3.35.
For that reason, the paper states that it is valid for D/r0≥3.5.
The probability applies only for the area covered by isoplanatic
angle (isoplanatic patch), usually less than 10 arc seconds
in diameter. Significantly larger image will have sporadic
isoplanatic patches with diffraction-limited phase error over them,
but the rest of image will have significantly lower
quality.
In terms of contrast transfer, the
effect of atmospheric error is given by atmospheric OTF (Optical
Transfer Function), which is for long exposure given by:
and for short exposure by
where exp(...) is ℯ(...),
ℯ being the natural
logarithm base, 2.718 rounded to three decimals, and ν
is the normalized spatial frequency. Atmospheric OTF represents contrast transfer degradation factor
due to turbulence, with the actual contrast transfer given as a product of the system OTF and atmospheric OTF.
It is important to note that the short exposure
relation is not accurate for higher frequencies, for v~0.5 and
larger. It produces higher contrast transfer in mid to high
frequency range. It also produces an upward contrast spike between
0.9 and 1 frequency, becoming exponentially more pronounced as D/r0
value increases beyond ~5 (as Mahajan states, it is the consequence
of assuming no correlation between tilt and roughness component of
the seeing error, which is not strictly correct). The worst part of
this high-frequency error - contrast spike up between 0.9 and 1
frequency - is effectively removed simply by using (1-ν1/3)
instead of (1-1.042ν1/3).
However, it still leaves in somewhat higher contrast in the mid to
high frequency range. It can be nearly corrected by further lowering
the constant in front of ν1/3
slightly below 1.
Combined atmospheric and
telescope contrast transfer is given by the product of their
respective OTF's. It is the final OTF in the image plane of the
objective. Obstructed apertures will have lower combined OTF due to
the contrast-lowering effect of central obstruction, but not more.
In fact, the larger obstruction, the larger relative size of r0
vs. annulus, resulting in the slower increase in phase variance over annulus area and, consequently, slower decrease in the average
Strehl (as a measure of wavefront quality, independent of the effect
of central obstruction). This beneficial effect partly offsets the
negative diffraction effect of central obstruction.
Effect of seeing on contrast transfer of a clear aberration-free aperture is
given by a product the seeing OTF and
Eq. 57, as shown
below.
The OTF plots show that, unlike classical aberrations, contrast drop
caused by relatively significant seeing errors continues to increase
toward high frequencies, without partial recovery in mid
frequencies. This is a consequence of the expanding central maxima,
which is the primary form of energy transfer with the seeing error
(as opposed to non-random, classical aberrations, which mainly
transfer energy to the rings, without significantly affecting size
of the central maxima). It also causes loss of resolution
sooner than classical aberrations that would result in similar
contrast level in the lower range of frequencies.
Looking at the short exposure graph, as more representative of the
visual seeing error in amateur-size apertures, it is evident that,
contrast-wise, larger apertures tend to remain ahead of the smallest
ones. The pattern is similar to that for
stellar resolution. A 3 times
larger aperture has the cutoff (zero contrast) projected from its
mid-to-low frequencies (dashed line) still about 45% of the full
resolving range for this aperture size, and 5 times larger aperture
about 22% of the full resolving range for its aperture size.
Adjusting for normalization (effectively, by compressing the plot
horizontally by a ratio smaller-to-larger aperture diameter, i.e.
smaller-to-larger D/r0
value), the 3 times larger
aperture acts as about 30% larger aperture, contrast-wise, than the unit (D/r0=1)
aperture, and 5 times larger aperture as about 10% larger (note that
both larger apertures do maintain significant contrast well beyond
the cutoff frequency of the smaller unit aperture, which are here
0.33 and 0.2, respectively, as well as beyond their projected
cutoffs). This directly
implies that 3 times larger aperture has better contrast level than
either significantly smaller, or significantly larger apertures.
However, looking at the approximate visual plots, they are already
closer to their respective long-exposure plots for D/r~3, and nearly
coinciding with them for D/r~5 an larger. It makes improbable that
five times larger aperture has any significant advantage in contrast
transfer over the one for which D/r~1. Those 2 to 3 times larger are
still better, and represent the best aperture range with respect to
contrast transfer.
The discrepancy between the optimum aperture diameter being about 2r0
for limiting stellar resolution, and 2-3r0
for contrast transfer should be mainly the consequence of the
short-exposure MTF becoming less representative of the actual visual MTF as D/r0
increases to ~2 and beyond, due to the increase in the effective
magnitude of the tilt error component. In other words, their actual
MTF plots are shifted toward the long-exposure plots, the larger D/r0,
the more so. Consequently, the optimum D/r0
shifts toward lower value, in this case 2.
However, considering that seeing fluctuates, and that it will always
be better than the average within appreciable portion of time, an
optimum aperture, which would perform best during those times,
should be somewhat larger than 2r0.
Assuming that, according to the simplistic scheme on
FIG. 82, seeing is
likely to be 25% or more better than the average in about 1/4 of the
time, the optimum aperture would be about 25% larger, or about 2.5r0.
Factoring in those relatively frequent nights when the seeing gets
better than typical would increase it to about 3r0.
Since it is the contrast level that determines resolution
limit to extended details, like those on planetary surface, this
implies that larger apertures, in general, outperform smallest ones in this
respect, despite having a larger seeing error. At the same time, a
range of apertures between really large and small apertures offer
best performance level.
As the magnitude of seeing error increases, the visual seeing error
shifts closer to the long exposure mode (FIG. 87, bottom). As the
graph at left shows, even in the full long-exposure mode
(unlikely to occur in visual observing), loss of contrast transfer
in larger apertures tends to be roughly offset by their size. In
other words, contrast level remains similar in wide range of
apertures. Since the actual visual seeing is between short- and
long-exposure mode, the implication is that larger apertures tend to
retain edge in contrast-related resolution, with the optimum
aperture size being somewhere between small (D/r0~1)
and large ones (D/r0~5,
or more).
Closer to the observer, it is terrain topography, immediate
surroundings and the very parts of a telescope itself that can
create layers of unsteady air resulting in
wavefront deformations.
|
|||||||||||||||||||||||||||||||||||||||||||||||||||||||||||||||||||||||||||||||||||||||||||||||||||||||||||||||||||||||||||||||||||||||||||||||||||||||||||||||