|
telescopeѲptics.net
▪
▪
▪
▪
▪▪▪▪
▪
▪
▪
▪
▪
▪
▪
▪
▪ CONTENTS ◄ 4.9. Transmission materials' effects ▐ 5.1.2. Limitations to the standard model ► 5. INDUCED ABERRATIONS Wavefront aberrations not resulting from the inherent properties of optical surfaces are more than common: to some degree, they are affecting imaging quality of telescopes at all times. According to their origin, they can be result of: (1) air non-homogeneity, (2) alignment errors, and (3) forced surface deformations. Some induced aberrations may be identical in form to those inherent to conical surfaces - for instance spherical aberration created by despace error in multi-element systems, or due to thermal expansion or contraction - but they remain dependant of factors other than inherent properties of optical surfaces in their proper use and near-optimum environment. 5.1. Air-medium errors
Wavefronts can preserve their form only if the media they move through
are optically homogeneous. In
other words, when every wavefront point
propagates at identical speed. Thus, inhomogeneous media induce random
wavefront deviations, resulting in optical aberrations. Air is by far
the largest media through
which light travels before forming the image
in a telescope. What causes air to be inhomogeneous medium for the light
are thermal effects, creating randomly changing structures consisting of
streams and eddies of air of varying temperatures.
Since air optical density, and so the speed at which light
propagates through it, changes with the temperature, such random thermal
structures cause it to become an optically inhomogeneous media. In various
forms, it begins in the high layers of Earth's atmosphere and extends
all the way down to both, outside and the inside of a telescope tube,
including layers of turbulent air forming around optical
surfaces. 5.1.1. Atmospheric turbulenceThe basic principles for the statistical evaluation of the error induced to wavefront passing through atmospheric turbulence were proposed by Kolmogorov in 1941, as a scaling law, based on successive transfer of kinetic energy from the largest to smaller turbulent structures. Together with Obukhov's law, describing structure function of the refractive index under conditions of turbulence, it supplied the basic tools for expressing the effect of turbulence on the integrity of the wavefront passing through it. The theory further evolved through the works of Tatarski, Fried, Noll, Roddier, and others, making possible major advance in the performance of large ground telescopes by use of adaptive optics systems. Since based on the Kolmogorov's theory, it is regarded as Kolmogorov model, or theory (of turbulence), and it's the one usually applied to describe the effects of seeing on imaging with telescopes. The formalism here is from this model of turbulence. The two main mechanisms inducing seeing error in telescopes are (1) vertical air movement caused by warmer air raising and mixing with cooler air above, and (2) upper level winds carrying this relatively slowly changing turbulent structure consisting of air pockets varying in size, temperature and refractive index across the window of the aperture. Variations in the temperature cause refractive index variations, which in turn correspondingly advance or delay points on the wavefront relative, breaking up its form. Small-scale variations in air optical properties - at the level of smaller turbulent cells - are the primary source of wavefront roughness. Temperature/index variation at larger scales creates wavefront tilt deformation. Deviations from uniformity in the refractive index, phase and wave are statistically defined through the corresponding structure functions. The structure function of the refractive index fluctuations is the mean square of the difference in refractive index at two separated points in space. Similarly, the structure function of phase fluctuations resulting from index fluctuations is the mean square of the phase differential at these two points. And the wave structure function is a sum of the phase structure function and log-amplitude structure function, the latter describing change in wave amplitude due to turbulence. Schematic illustration below (FIG. 75 top left) shows the basic mechanism of wavefront distortion by turbulent air. For simplicity, it is reduced to a single layer, darker hue representing cooler, optically denser air. Small aperture suffers low-level roughness, and mainly inconsequential tilt error tending to move the image as a whole in time intervals sufficiently long for the eye to follow (depends mainly on the wind speed). Large aperture is more affected by roughness, breaking diffraction pattern into a speckle structure, with individual speckles popping up, moving around and disappearing mainly as a consequence of the sideways movement of turbulent air, producing quickly changing patterns of turbulent cells and inducing variations of the tilt component. So the structure, shape and extent of speckle pattern changes simultaneously due to the constant change in the pattern of turbulent air-cells and change in the tilt component, the former causing constant change of the speckle structure, and the later causing random movement of larger portions of the image and image as a whole. Speckle pattern remains nearly unchanged over time intervals measured in milliseconds. Two speckle patterns are similar only over solid angle of a few arc seconds (isoplanatic angle), depending on the strength of turbulence and the height of the dominant turbulence layer. General relations for isoplanatic angle is ι=r0/h, with r0 being the Fried parameter (also: cohherence length), and h the turbulence height. For r0 and h in meters, it gives the isoplanatic angle in arc seconds. With the average values, r0~0.07m and h~5km (the actual value of h is determined by the turbulence intensity structure from upper atmosphere to the ground layer), ι~2.9". Also, any given speckle pattern remains nearly unchanged only for very brief period of time, so called coherence time, determined by the wind speed and direction. In the direction of wind, it is expressed by τ=r0/v, where v is the wind speed. For r0 in mm and wind speed in meters per second, it gives the coherence time in milliseconds. With the typical wind speed of ~20m/s, in the average seeing (r0~70mm, λ=550nm) τ~3.5ms.
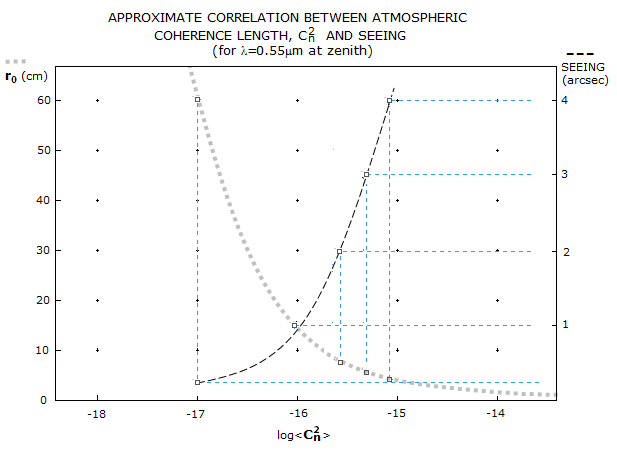
Hufnagel-Valley Boundary model of the atmospheric turbulence profile is a generalized, very rudimentary model of the structure of atmospheric layers generating turbulence. It indicates only two distinctive layers, one gravitating toward the dividing line between troposphere and stratosphere, and the other forming toward the planetary boundary layer, most intensely within less than 500m above ground. The strength of turbulence is indicated by the quantity Cn2, called the structure constant of the refractive index fluctuations (normalized to 1 for the peak turbulence strength on the graph), the main component of the structure function of the refractive index fluctuations due to turbulence, Dn=Cn2r, where r is the distance between two points over which the fluctuation is accumulated. The Cn2 itself is a function of air pressure, temperature and the rate of energy generation per unit mass. The logCn2 plot compresses wide variation in the turbulence strength with altitude; the Cn2 plot indicates that the contributions to the total strength of turbulence is roughly divided between the turbulence within the boundary layer, called ground turbulence, and turbulence in the higher atmosphere. The latter is generally much weaker, but it is compensated by much longer total path length through it. The actual structure of the turbulent atmospheric layers vary widely with the locality and time; in general, main contributors to the turbulence strength are the boundary layer and up to several layers of stronger turbulence in the higher atmosphere. Seeing is usually at its best when the upper turbulence layers are relatively weak, leaving the lower-level turbulence as the dominant component. Looking at the depiction of the tilt component of the seeing-perturbed wavefront directly suggests that the tilt error will be larger in larger aperture. While wavefront tilt over an extended portion of it doesn't change significantly, the nominal error is, in first approximation, proportional to the extent of the wavefront over the aperture. While there will be relatively small difference in either nominal linear or angular image motion caused by this error, the relative movement - in terms of angular size of the aberration-free FWHM, will be increasing with the aperture. Also, with given wind speed, the frequency of change in the direction/magnitude of tilt error is also larger in larger aperture. The consequence for visual observing is that the eye gradually loses the ability to follow the image motion going from relatively small toward more significant seeing errors, with the image becoming increasingly more blurred, as a result. Note that the above depiction of atmospheric coherence length (explained in more details ahead) is a statistical fiction; actual size of orthogonally projected atmospheric segments over which the error generated by wavefront doesn't exceed any given value varies more or less significantly around the average value. The actual size of turbulent structures covers wide span between so called the outer and inner scale of turbulence, with the former increasing from about 1m close to the ground to a few hundred meters high in the atmosphere, and the latter from 1-2 mm above the ground to a few cm in higher atmosphere. At the level of inner scale of turbulence, kinetic energy starts dissipating into heat by viscous friction, dampening transfer of kinetic energy (i.e. turbulent motions) within smaller structures. In general, inner and outer scale of seeing change in inverse manner with seeing quality, with the former becoming larger in better seeing, and the latter smaller, with less energy initiating a turbulence. When the turbulence is strong enough to break up and enlarge the central diffraction maxima, telescope resolution is determined by the atmosphere, rather than aperture size. The central maxima of PSF expanded by turbulence (atmospheric PSF) is called the seeing disc, and its FWHM the seeing. While the strength of turbulence varies constantly, an average error to the wavefront passing through it can be expressed in terms of atmospheric coherence length (or atmospheric coherence diameter). This parameter is defined as the turbulence diameter over which the time-averaged error induced to the wavefront doesn't exceed one phase radian (1/2π of the full wave phase of 2π radians). It is usually called Fried parameter, and denoted by r0. The parameter is defined so that, to a first approximation, telescope's resolving power is limited by its aperture for r0>D, and by the atmosphere for r0<D.The structure constant of the refractive index Cn2 is one of the determinants of the size of r0, which is for plane wave propagating through Kolmogorov turbulence given as:
r0
= 0.185λ1.2cos0.6γ[∫Cn2(L)dL]-0.6
with λ
being the wavelength,
γ the zenith angle, L the wave path length through
the atmosphere, and quantity in brackets the integrated (summed up)
values of Cn2
along this path. For the mean Cn2
value for the entire path, denoted by Cn20, it can be written as
r0
= 0.185λ1.2cos0.6(γ)(Cn20L)-0.6.
Alternately, r0=1.68(Cn20Lk2)-0.6,
with k=2π, also for plane wave.
In Kolmogorov turbulence,
r0
can be used to define statistical changes in wave properties with a simple relation Dw=6.88(r/r0)5/3, where r is the separation between two points in space, representing phase
structure function in rad2. The constant value of 6.88 is chosen so that it gives ~1 rad2 variance for r=r0. Since the standard phase deviation - analog to the RMS wavefront error - is the square root of variance (1/2π)2, i.e. 1/2π radians, it means that the averaged wavefront deviation over a circular, vertically projeted atmospheric patch of diameter equaling
r0 will be approximatelly 1/6 of the full wave, i.e. 1/6 wave RMS, comparable to a little more than 1/2 wave P-V of primary spherical aberration (the exact value for the variance is 1.0456/(2π)2).
Typical Cn2
values in the lower 20km, or so, of the atmosphere range from 10-14
for strong turbulence to 10-19
m-2/3
(cm) for very weak turbulence, with the highest values in the free atmosphere
being at the height of about 10km, while reaching its maximum well inside the
boundary layer. The latter is commonly dozens of times stronger, on the
average, than the free atmosphere turbulence, but with its depth (path) roughly as much smaller,
its error contribution is roughly comparable to that of the free
atmosphere.
In terms of the mean atmospheric structure constant Cn20, it is most often between
10-15
and 10-17.
Taking λ=0.000055cm, γ=0 (so cosγ=1), L=2,000,000cm (20km), gives the corresponding zenith
range in
r0
from about 3.8cm to 60cm, respectively or, in terms of seeing, with
r0~14.4
cm for this wavelength in 1 arc second seeing, from about 4 to 0.25 arc
second, in the same order. Above graph illustrates the dinamics of change in r0 and seeing.
In terms of r0,
the FWHM of long-exposure atmospheric PSF (seeing) is given by
FWHML=0.98λ/r0,
in radians (FWHML=202,140λ/r0
in arc seconds), with λ
being the wavelength for which r0
is calculated. Other seeing parameters are also related to
r0.
The larger r0,
the wider isoplanatic angle. In the simplest case with a single
turbulent layer at the height h, isoplanatis angle is given by θ0=r0/h
in radians. For, say, r0=70
mm and h=5km, isoplanatic angle is three arc seconds. Obviously, for
given r0,
isoplanatic angle is the largest when ground turbulence is a dominant
component.
Likewise, for the simplest case with a single turbulent layer moving in
the direction of wind, coherence time is given by τ0=r0/ν,
in milliseconds, with ν being the
wind speed in m/sec. For the same r0=60mm
and wind speed of 15 m/sec, coherence time is 4 milliseconds.
EFFECT ON THE WAVEFRONT Wavefront deformations
caused by atmospheric turbulence are
ever-present, only vary in amplitude. The effect is popularly called
the seeing error, and measured either through empirical scales of
seeing quality - such as Pickering's 1-10 (FIG. 76) and Antoniadi
1-5 scale - or analytically, as given by
the optical theory's take on random aberrations. For given level of seeing
quality, an average wavefront error induced by atmospheric turbulence
increases with the aperture size.
Being random aberration, seeing error comprises many different
aberration forms constantly varying in magnitude. The dominant
long-exposure form is wavefront tilt. Short-exposure error is corrected
for tilt, and the remaining roughness component consists of a large
number of aberration components.
Different components of long-exposure
wavefront error caused by atmospheric turbulence can be quantified for
its time-averaged form using wide range of
Zernike terms of appropriate
magnitudes.
Table below lists first 12 components (21 counting sine and cosine terms
separately, as marked in the j column) of the Zernike-modeled time-averaged turbulence
error (variance source: Optical Imaging and Aberrations 2, Mahajan).
The table is based on Noll's
Zernike terms expansion concept.
Piston, or uniform aberration, has zero
variance over the pupil (it
only becomes source of aberration in a system with multiple pupils of
unequal phase); thus the first row gives values for the total
aberration, in units of (D/r0)5/6
for the error's standard deviation, in units of (D/r0)5/3
for the variance (i.e. standard deviation squared), and in units of the full
phase for the RMS wavefront error (i.e. the actual error is a product of the
nominal value in the table and the corresponding unit). It should be
noted that the RMS error obtained from the standard (phase) deviation by
dividing it by 2
Every next row gives values after the specified aberration
component is corrected and deducted from the total error; for instance, after correcting for the tilt component
in both cosine and sine term,
the residual phase variance (φ2) is 0.134, and the corresponding RMS
wavefront error (analog but not equivalent to the "phase wavefront error" i.e. standard phase deviaton) is 0.0583(D/r0)5/6,
D being the aperture diameter; since the RMS error differential to the error level before correction
for the tilt is 0.1032, it equals the term-specific RMS
wavefront error (for
cosine and sine tilt terms combined). The latter is given by the
differential between the residual RMS error for the previous and
following aberration. WAVEFRONT STRUCTURING OF THE
AVERAGED (LONG EXPOSURE) SEEING ERROR CORRECTED ZERNIKE COMPONENT RESIDUAL PHASE ERROR* RMS WFE ERROR
φ j
Variance
Standard Residual Term-specific # Order Name nominal** % nominal** % 1 - Piston 1 1.0299 1.0148 0.1615 100 0 0 2 2nd Tilt cosine term 2 0.582
0.763 0.1215 75.2 0.0400 25 sine term 3 0.134
0.366
0.0583 36.1 0.0632 39 3 2nd Defocus 4 0.111 0.333 0.0530 32.8 0.0053 3.3 4 4th Primary astigmatism
sine term 5 0.0880 0.297 0.0473 29.3 0.0057 3.5
cosine term 6
0.0648 0.255
0.0406 25.1 0.0067 4.2 5 4th
Primary coma
sine term 7 0.0587 0.242 0.0385 23.8 0.0021 1.3
cosine term 8
0.0525
0.229
0.0364 22.5 0.0021 1.3 6 6th
Elliptical coma (arrows, trefoil)
sine term 9 0.0463 0.215 0.0342 21.2 0.0022 1.4
cosine term 10
0.0401
0.200
0.0318 19.7 0.0024 1.5 7 4th
Primary spherical aberration 11 0.0377 0.194 0.0309 19.1 0.0009 <1 8 6th
Secondary astigmatism cosine term 12 0.0352 0.188 0.0299 18.5 0.0010 <1 sine term 13
0.0328 0.181
0.0288 17.8 0.0011 <1 9 8th
Quadrafoil cosine term 14
0.0304 0.174
0.0277 17.2 0.0011 <1 sine term 15
0.0279
0.167
0.0266 16.5 0.0011 <1 10 6th
Secondary coma cosine term 16 0.0267 0.163 0.0259 16.0 0.0007
<1 sine term 17
0.0255 0.160
0.0255 15.8 0.0004
<1 11 8th
Secondary trefoil cosine term 18
0.0243 0.156
0.0248 15.4 0.0007
<1 sine term 19
0.0232 0.152
0.0242 15.0 0.0006
<1 12 10th
Pentafoil cosine term 20
0.0220 0.148
0.0236 14.6 0.0006
<1 sine term 21
0.0208
0.144
0.0229 14.2 0.0007
<1 * in units of
radians/(D/r0)5/6,
radians2/(D/r0)5/3
when
squared (variance)
For higher orders (j>9), Noll's approximation for the residual variance
after the first J of Zernike j modes are removed is
φ2~0.2944J-0.866(D/r0)5/3.
Expectedly, the D/r0
quotient is one of the very basic parameters in imaging through
turbulence. It expresses the seeing disc to aberration-free FWHM ratio,
(λ/r0)/(λ/D),
hence its value directly indicates the size of long-exposure seeing disc
as larger from the aberraton-free FWHM by a factor of D/r0.
Since the total aberration is proportional to to 1.0148, the relative
error contribution of each separate error component is closely
approximated by their φ
differential; for defocus it is 0.033 (3.3%) of the total aberration,
and after the first 21 components are corrected, remaining aberration,
as the RMS wavefront error, is
14.2% of the total aberration.
In terms of r0
and the aperture diameter D, the long-exposure
atmospheric error as wavefront phase variance averaged over the pupil, is given by:
in rad2, with
φL being the RMS
wavefront deviation in units of the wavelength. Thus, the
corresponding long-exposure
RMS wavefront
error
with the wavelength λ
corresponding to that used to calculate the value of r0
(Eq. 55). This wavefront error has two
main components: (1) tilt, resulting in random image motion, and (2)
roughness, resulting in structural disintegration of the
diffraction pattern. Tilt component is dominant; as above table
shows (j3), it makes 87% of the variance, and 64% of the RMS
error. Short-exposure wavefront error
- with "short exposure" defined as sufficiently short to eliminate
image motion, i.e. the tilt error component - reduces to the RMS error due to wavefront roughness:
The standard Kolmogorov model of
turbulence uses certain assumptions which are not strictly met in
field conditions. This can significantly affect its accuracy. In
general, the actual error is smaller than what the model predicts,
as outlined in more details on the next page.
|
||||||||||||||||||||||||||||||||||||||||||||||||||||||||||||||||||||||||||||||||||||||||||||||||||||||||||||||||||||||||||||||||||||||||||||||||||||||||||||||||||||||||||||||||||||||||||||||||||||||||||||||||||||||||||||||||||||||||||||||||||||||||||||||||


 These relations imply that for any given
r
These relations imply that for any given
r