|
telescopeѲptics.net
▪
▪
▪
▪
▪▪▪▪
▪
▪
▪
▪
▪
▪
▪
▪
▪ CONTENTS ◄ 6.7. Coherent transfer function, Fourier transform ▐ 7.1.1. Inconsistencies in the theoretical concept? ► 7. THE EFFECTS OF APERTURE OBSTRUCTIONPAGE HIGHLIGHTS (for central obstruction effect)
Any obstruction placed in the light path of an imaging system prevents
waves from a portion of the wavefront to reach the focal zone. The
consequence is change in wave contribution at every point of
the diffraction pattern. The effect
is similar to that of wavefront aberrations in that it changes
pattern's intensity distribution, the specifics of it depending on
the form and size of obstruction. Those common to amateur telescopes
are: (1) central obstruction, a solid circular obstruction
usually caused by the secondary mirror or its cell, (2) secondary
holder vanes and (3) apodizing mask. The light loss is
significant only with apodizing mask. Real concern is the change in
point-object image intensity distribution caused by the changes in
pupil transmission properties, and its effect on image quality.
Diffraction effect of unusual spider vane forms, mirror clips and
protruding focuser tube can be found on the
Miscellaneous optics page.
Also,
obstruction effect of baffles on off axis point imaging
is shown with two-mirror reflecting systems.
Much has been said about the effect of
central obstruction in the amateurs circles, most of it
being speculation. The common notion is that it reduces effective
linear aperture for low-contrast details by as much as obstruction
diameter. Informal attempts have been made to find a theoretical basis
for this empirical "rule". Not a few amateurs "tested"
it and often concluded that it "works". What tends to be
neglected is the pretty obvious fact that in any such comparison there
is more than just a single factor - central obstruction - affecting
low-contrast performance. Most of these factors - seeing error,
overall optical quality, sensitivity to miscollimation and thermal
errors, light scatter, baffling - favor smaller unobstructed aperture,
usually a high-quality apochromatic refractor, over the larger
reflector or catadioptric. Consequently, if the rule "works"
empirically, it inadvertently proves it incorrect, as long as it
insists on the difference in performance coming from the effect of
central obstruction alone.
Before going to the specifics of central obstruction effect,
a few words about the standard mathematical formalism used to
express them. It assumes coherent light, same as with a
clear aperture PSF, where intensity (energy) is obtained
by adding individual wave amplitudes, and squaring the sum.
Central obstruction is treated as inverse aperture, whose amplitude
spread function (ASF) is deducted from the clear-aperture-ASF,
and the differential is then squared for the corresponding PSF
(shown below for o=0.33 obstruction).
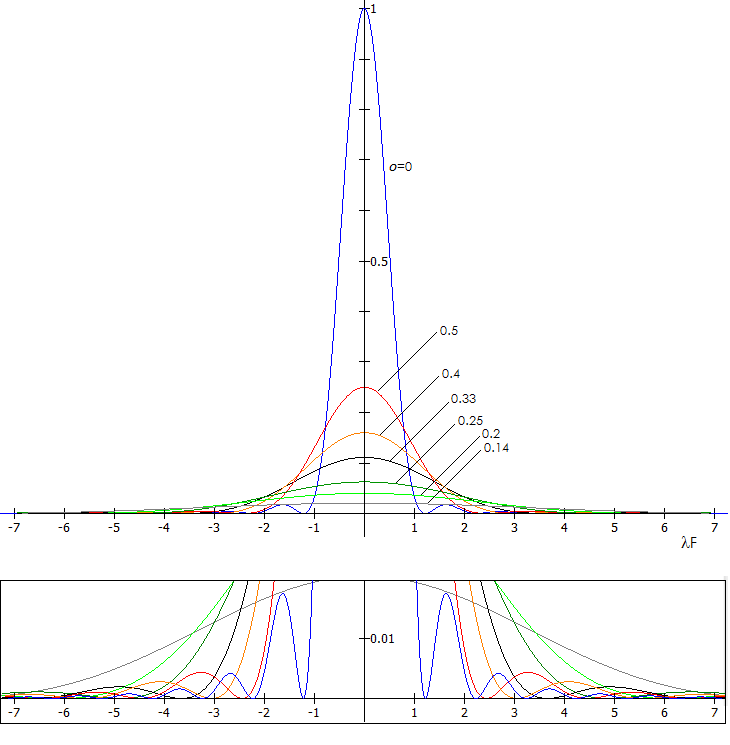
The inverse aperture PSFs are shown below for selected obstruction sizes,
with the ring area magnified vertically (bottom box).
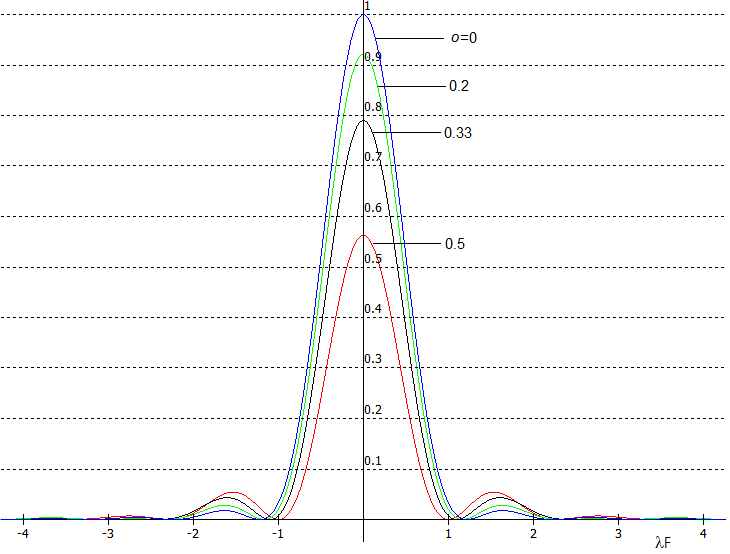
The resulting PSF of an obstructed aperture - as the PSF differential
between unobstructed aperture and inverse aperture equaling obstruction
diameter (i.e. unobstructed minus inverse PSF) - for some common obstruction
sizes, are shown below.
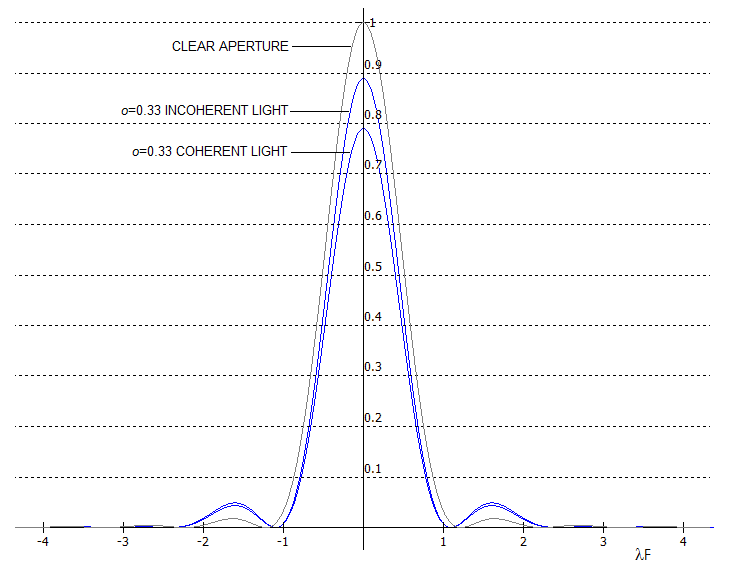
However, light typically
encountered in amateur observations is generally incoherent.
The two interfere differently: as already mentioned, coherent
light adds up at the
amplitude level, with the intensity given as the square of
complex amplitude, while incoherent light sums up at the
intensity level, as a sum of squared amplitudes of individual
waves. This greatly affects the actual intensity
(below, for the actual intensity of coherent light normalized to 1),
but the relative intensity distribution of the diffraction image
of a point source (PSF) is identical for either light form
for unobstructed aperture.
This generally should hold for obstructed aperture as well, which
means that the numerical central intensity for an obstructed aperture
for any given obstruction size will be lower for
coherent vs. incoherent light. For instance, according to
the standard formalism, peak PSF intensity of obstructed
aperture is lower by a factor (1-o2)2,
i.e. obstruction o=0.33 lowers peak intensity to 0.794, but
it is only valid for coherent light; for incoherent light
central intensity will be lower in proportion to the relative
obstruction area, i.e. 0.891. It is consistent with the known
fact that for incoherent light the energy is proportional to
the aperture area (standard formalism also uses the peak
intensity proportional to aperture area, but only when a
constant flux is assumed).
With that stated, the effects of central obstruction are:
(1) reduction in light transmission by a factor of (1-ο2),
resulting from pupil obscuration,
(2) reduction in the relative peak diffraction intensity - and the energy
content of the central maxima - by a factor (1-ο2)2,
for coherent light,
(3) reduction in the size of central maxima, by a ratio closely approximated
with 1-o2+o4, and
(4) longitudinal extension of the diffraction pattern by a factor 1+ο2.
For incoherent light,
the effective peak intensity reduction in the context of the relative
intensity distribution is given by (1-ο2).
However, since the first minima shrinks in size, the total loss of
energy from the central maxima is correspondingly larger, approximately
by a factor 1-o2+o4. For coherent
light, the loss of actual energy is higher, since its central intensity
is lower, but the relative energy loss vs. total energy in the pattern
is the same (i.e. the central peak is lover, but so are the ring maximas).
The total relative loss of energy from the Airy disc is well
approximated with double the relative obstruction area in the pupil,
or 2ο2.
Consequences of the latter in regard to intensity distribution within
diffraction pattern differ somewhat for near-perfect wavefront on one
side, and aberrated wavefronts on the other. Depending on the type and
size of wavefront deformation, presence of central obstruction may
improve, worsen, or have no appreciable effect on wavefront quality
within the annulus, compared to the quality of the entire wavefront.
This effect is small to negligible for the usual range of central
obstruction sizes.
Since the central maxima volume, representing its share of energy,
changes nearly in proportion to its base area (figure of the
bell-shaped curve does not stay strictly identical with the change of
CO size, but the deviations are near-negligible), the energy loss from
the central maxima due to CO can be conditionally expressed as the
relative peak diffraction intensity drop I'(0)
in an obstructed aberration-free aperture vs. that in a clear
aberration-free aperture, I(0), normalized to 1, as:
which is, in effect, the relative annulus area (in units of the clear
aperture area) squared (keeping in mind that it is different in what
it represents from the formally identical expression for the drop in
the absolute peak intensity). In this context, it implies that the
size of CO corresponding to a given peak diffraction intensity
I'(0) is ο=(1-√I)1/2.
With the relative intensity distribution - the basis for contrast
transfer - being independent of the actual peak intensity, PSF of an
obstructed aperture is conventionally normalized to unity for its
actual peak intensity, i.e. given as Changes in the incident flux (point-source intensity) do affect actual pattern brightness, but not the relative intensity distribution within diffraction pattern, which is what determines the efficiency of contrast transfer. NOMINAL CHANGES IN INTENSITY DISTRIBUTION WITH THE CHANGE OF C.O.
Following table presents
intensity distribution within the fourth minima for unobstructed and
selected obstructed apertures. Pattern radius r is in units of
λF, and intensity I'(r) is normalized to peak diffraction intensity, to reflect more clearly relative changes in intensity distribution; EE' is encircled energy. Analogously to the central intensity, the actual relative encircled energy of the obstructed aperture is smaller by a factor (1-ο2)2, or EE=(1-ο2)2EE'. For ο=0.30, energy encircled within first minima is 0.565, with 0.263 in the rings, but their values relative to the peak intensity - which is what matters for contrast transfer - are as shown in the table. If the photon flux in the annulus would equal that in the unobstructed aperture, both figures would be larger by a factor of 1/(1-ο2)2, or 0.682 and 0.318, respectively, and the central intensity would be identical to that of the clear aperture.
As plots above indicate, most of the energy lost to the central maxima is transferred to the first bright ring with obstructions of 0.4D and smaller, while larger obstructions also brighten the 2nd bright ring. Logarithmic PSF shows much better the effect of obstruction on intensity and pattern of fainter rings (for clarity, given only for the ο values of 0, 0.30 and 0.50). The increase of energy transferred farther away is moderate up to about 0.3D CO. With 0.4D, energy beyond six Airy disc radii from the pattern center is more than 50% greater than for unobstructed aperture, and for 0.5 CO it is more than doubled. This is not unusual; for instance, primary spherical aberration (0.4 wave P-V) causing near identical relative drop in the peak PSF intensity as 0.5D CO increases the energy beyond that point less than 20% below the increase due to the obstruction. Coma (2/3 wave P-V) more than 40% below, but considering its magnitude in the outer field of fast paraboloids, it will brighten background much more than central obstruction (which is normally significantly smaller than 0.5D). Astigmatism (0.6 wave P-V) actually reduces the energy level beyond that point, and so on. Nominal change in the normalized peak intensity, given by ΔI = 1-I'(0), closely approximates the relative amount of energy transferred from the disc to the rings area. For instance, 30% CO (ο=0.3) will lower normalized central diffraction intensity produced by a perfect wavefront from 1 to 0.828; at the same time, relative transfer of energy from the Airy disc to the rings area is ~0.17, or 17%. A simple rule of thumb is that the relative loss of energy up to ο ~0.4 is closely approximated - as a ratio number - by 2ο2, and for ο~0.5 and larger by 1.9ο2. THE CONDITIONAL "RELATIVE PEAK INTENSITY" OF OBSTRUCTED APERTURE VS. STREHL RATIO; MTFFor instance, 33% linear CO (ο=0.33) effectively reduces normalized central intensity to 0.79. Does that make its effect comparable to that of 0.79 Strehl wavefront error equivalent? Yes and no. There is a distinct difference in the energy distribution change caused by CO compared to, say, primary spherical aberration at the best focus. Looking at the energy in the central maxima as the volume under the bell-shaped curve, the main effect of spherical aberration is reducing the height of this volume, with the reduction of volume base (width) being nearly negligible in comparison (for given energy density under the volume, as illustrated on FIG. 2). Specifically, 1/4 wave P-V wavefront error reduces central intensity by 20%, while shrinking the central maxima less than 3% linearly. The difference in volume (energy) vs. aberration-free volume is transferred to the rings area; it is approximately 20%, closely approximated by the relative reduction in central intensity. On the other hand, the relative volume height corresponding to the central maxima is reduced only by 11% due to the effect of 33% CO, but its base is also reduced by nearly as much linearly. When normalized to 1 for the new (reduced) peak, the relative energy loss comes from its base radius smaller by a 1-o2 factor; since it is the square of it that determines the volume for given height, the relative energy loss is also around 21%. Thus, the relative volume reduction - i.e. energy loss to the rings - is nearly identical to that caused by 1/4 wave P-V of spherical aberration. Another similarity is that most of this energy goes to the 1st bright ring in either case. As a result, contrast transfer over the range of MTF frequencies where the rings energy is dominant factor - from 0 to about 0.4 - is also very similar. However, due to the smaller central maxima, the obstructed pattern rebounds in contrast transfer not only above the aberrated clear aperture level. In the range of MTF frequencies where the dominant factor of contrast transfer becomes the size of central maxima, generally from about 0.4 to 1, contrast transfer for aperture with D/3 CO also rises above that for clear aberration-free aperture. The similarity extends to the contrast drop-off for the range of spatial frequencies below ~0.5 (approximately, left side of the MTF graph), which is the range of resolvable low-contrast details. In other words, for this range of spatial frequencies, the peak intensity I'(0) resulting from CO is comparable to the Strehl ratio for wavefront aberrations with respect to the effect on contrast and resolution. They both indicate relative amount of energy transferred to the rings area, the main factor determining contrast level at low- to mid-frequencies of the MTF. Thus, with the RMS wavefront error ω in terms of the Strehl ratio S being given by ω=0.24√-logS, direct relation can be established between the relative linear size ο of CO and similar in effect RMS wavefront error ω (in units of the wavelength) with respect to low-contrast detail effect as: ω~0.24[-log(1-ο2) 2 ]1/2 (61) (it can be simplified to an empirical approximation, ω~0.24 ο for ο <0.3 and ώ ~0.25ο for 0.15<ο<0.3). For ο =0.325, this gives ώ~0.075, practically equal to 1/4 wave P-V of primary spherical aberration level. Comparison with the effect of spherical aberration is most appropriate, due to both CO and spherical aberration causing radially symmetric intensity distribution, with the predominant pattern change being brightening and widening of the first bright ring. However, the actual MTF graph (FIG. 104) indicates that the above formula is somewhat pessimistic in regard to the effect of CO. Obstructed aperture has significantly better contrast transfer - even better than that of a perfect aperture - in the right half of MTF frequency range (i.e. for details smaller than about 2 λF linear, or 2 λ/D in radians. Even in the left half of the graph (range of resolvable low contrast details), obstructed aperture has an edge. The reason is the effect unique to CO (at least in its extent), namely, the reduction in size of central maxima caused by it. The linear reduction is closely approximated by a factor (1-ο2 ) for obstructions of ~D/3 and smaller, and by a factor (1-ο2 +ο4 ) for larger obstructions, up to ~0.7D. Good approximation for the 1st minima reduction ratio for any obstruction size is 1-οn , with n=2+[ο2 /(1-ο)], or n=a+(1/a), with a=1-ο. The smaller central maxima, combined with more of the outer energy contained in the 1st bright ring, gives to the obstructed aperture an edge in contrast transfer efficiency with respect to the spherical aberration error of near identical nominal energy loss from the Airy disc. In effect, point-object-resolution-wise, central obstruction makes the aperture act as larger by a 1/(1-ο2 ) factor with added equivalent of (1-ο2 )2 Strehl of primary spherical aberration.
* There is a small difference between polychromatic (photopic) and monochromatic MTF plot even for non-refractive optics, showing as lower contrast transfer in the ~0.4-0.6 frequency range of the polychromatic MTF, due to the longer wavelengths forming slightly larger Airy disc. However, it doesn't change appreciably plot appearance, due to perfect aperture being affected in the same manner. This effect is present at all obstruction sizes. As a result, size of CO causing similar contrast drop to that caused by the amount of low spherical aberration indicated by Eq. 60 is, for the range of resolvable low contrast details (left half of the MTF graph), nearly 10% larger, linearly. Thus better approximation for the RMS error of spherical aberration similar in effect to that of the central obstruction ο for this frequency range is given by: ω~0.22[-log(1-ο 2 )2 ]1/2 (61.1) (it can also be simplified to an empirical approximation, ω~0.21 ο; it is within a couple of percentage points from the true value for ο ~0.4 and smaller) .
Contrast drop caused by central obstruction is better presented with
the perfect MTF normalized to 1, i.e. dividing contrast transfer of obstructed
with contrast transfer of unobstructed aperture (red plots below).
Note that the MTF output varies somewhat from one program to another. For instance, Aberrator and ATMOS show more of a contrast drop resulting from CO than OSLO. It still has an edge over spherical aberration, but the numerical constant in the above approximation is between 0.22 and 0.23. MTF plots for the relative contrast transfer above are based on equations given by Schroeder (Astronomical Optics 1st ed. p205). Constantly higher high-frequency contrast transfer in an obstructed aperture indicates non-zero contrast transfer at the cutoff frequency of unobstructed aperture, but that would not have practical significance. Analogous to the contrast transfer of a perfect aperture (FIG. 45, top right), that of an obstructed aperture is given by the overlapping area of two unit-diameter circles, but this time for the two annuli, and relative to the annulus area. As mentioned on the MTF page, the standard MTF plot, as the one above, shows contrast transfer for sinusoidal intensity distribution. As the pattern of intensity distribution and/or detail shape, changes, so does its contrast transfer. This can be illustrated comparing MTF for standard sinusoidal pattern with the contrast transfer function (CTF) for square-wave distribution (i.e. clear dark and bright lines), as shown on FIG. 105.
The overall effect on contrast transfer here is similar, with probably the most significant difference being that the limiting low-contrast resolution (the pattern in top right corners are high-contrast patterns, for which cutoff frequency lies at the horizontal scale) is somewhat reduced for the standard sinusoidal MTF pattern, but not for the square-wave pattern. Next page addresses apparent inconsistencies and the question of applicable concept in the standard theoretical treatment of the effect of central obstruction. ◄ 6.7. Coherent transfer function, Fourier transform ▐ 7.1.1. Inconsistencies in the theoretical concept? ►
|
||||||||||||||||||||||||||||||||||||||||||||||||||||||||||||||||||||||||||||||||||||||||||||||||||||||||||||||||||||||||||||||||||||||||||||||||||||||||||||||||||||||||||||||||||||||||||||||||||||||||||||||||||||||||||||||||||||||||||||
 While the effect on image contrast is the most important one in most
cases, it is not the only one. All of the effects of central
obstruction are dependent on its size relative to the aperture.
Hereafter, the relative central obstruction diameter in units of
aperture diameter D is denoted by ο
(left). As it will show ahead, the effects of central obstruction are
more closely related to its relative area vs. area of clear aperture
(or, alternately, to the relative annulus area), than to its relative
linear size. While specialized optical instruments can have central
obstruction well in excess of 0.5D, in most of amateur telescopes it
is in the 0.2D to 0.5D range. Effects of obstructions significantly
larger than 0.5D is
While the effect on image contrast is the most important one in most
cases, it is not the only one. All of the effects of central
obstruction are dependent on its size relative to the aperture.
Hereafter, the relative central obstruction diameter in units of
aperture diameter D is denoted by ο
(left). As it will show ahead, the effects of central obstruction are
more closely related to its relative area vs. area of clear aperture
(or, alternately, to the relative annulus area), than to its relative
linear size. While specialized optical instruments can have central
obstruction well in excess of 0.5D, in most of amateur telescopes it
is in the 0.2D to 0.5D range. Effects of obstructions significantly
larger than 0.5D is 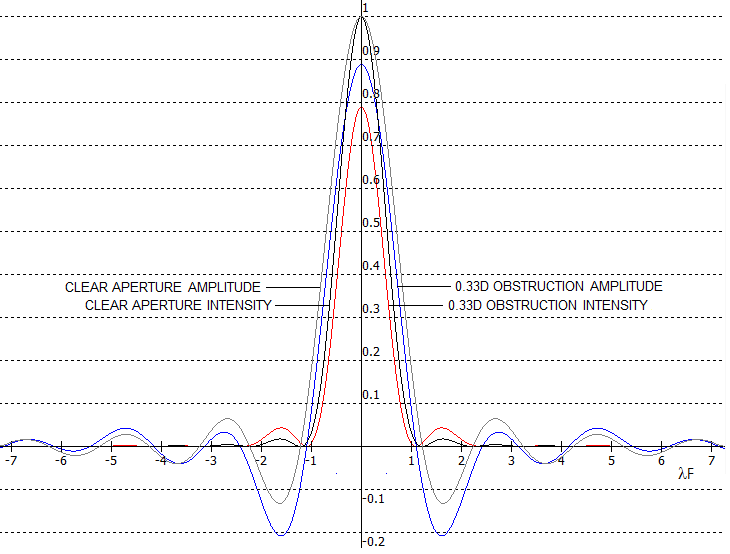

 The consequence of the shrinking central maxima in aperture with CO,
unlike, generally, apertures with aberrations, is that it retains the average
brightness of aberration-free aperture. As illustration, at left are
plotted PSFs for 1/4 wave of primary spherical aberration and for 0.33D CO,
both having nearly equal proportion of energy in the central maxima,
with the former often used as comparable in effect on image quality.
The plots show the difference in energy distribution, and the diffraction
images of equally bright stars at 1.75x the diffraction limit of λ/D
in radians (multiplied with 206.265 for arc seconds), correponding to
MTF spatial frequency of about 0.57, show beter contrast of the
obstructed aperture. It can be attributed to the brighter central
maxima, and also less energy in the first dark ring.
The consequence of the shrinking central maxima in aperture with CO,
unlike, generally, apertures with aberrations, is that it retains the average
brightness of aberration-free aperture. As illustration, at left are
plotted PSFs for 1/4 wave of primary spherical aberration and for 0.33D CO,
both having nearly equal proportion of energy in the central maxima,
with the former often used as comparable in effect on image quality.
The plots show the difference in energy distribution, and the diffraction
images of equally bright stars at 1.75x the diffraction limit of λ/D
in radians (multiplied with 206.265 for arc seconds), correponding to
MTF spatial frequency of about 0.57, show beter contrast of the
obstructed aperture. It can be attributed to the brighter central
maxima, and also less energy in the first dark ring. I'
I'

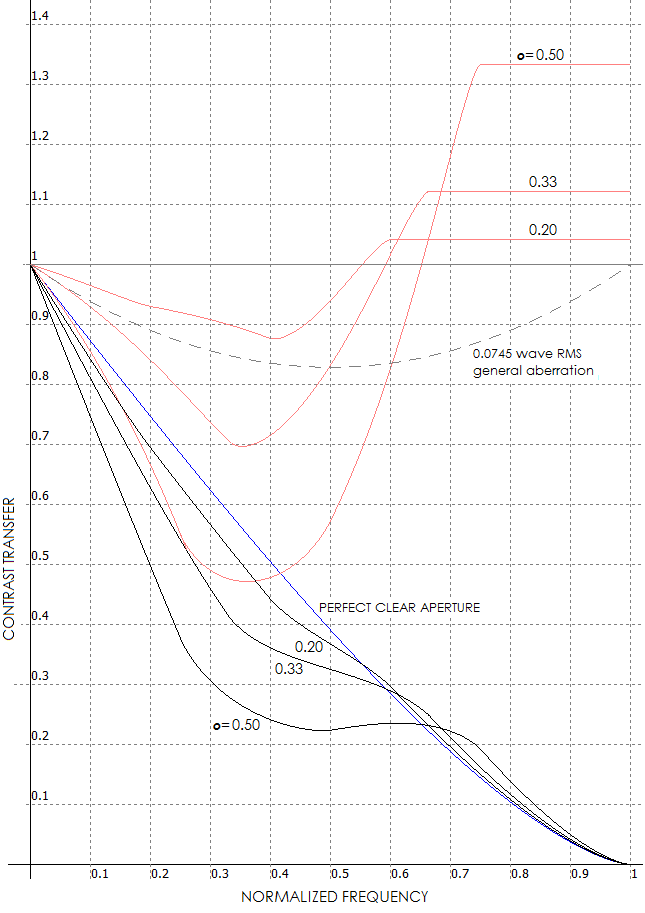 Obstruction size of D/3 (i.e. o=0.33) is often compared in the effect to 1/4 wave
of spherical aberration, but the normalized MTF shows significant differences
in the low-to-medium vs. high frequency range. Compared to generalized 1/4 wave
(0.0745 RMS) aberration - very similar to 0.26 wave P-V of defocus - obstructed aperture
has larger drop in the low-to-medium range, bouncing up to the levels higher than
perfect unobstructed aperture in the high frequency range. Considering that most of
observable details are in the left half of the MTF graph (i.e. those about twice the
stellar resolution limit, or larger), the advantage of obstructed aperture in
the high frequency range is less important than its disadvantage in the low-to-medium
range. For instance, cutoff frequency (ν=1) for 100mm aperture is 1.13 arc seconds, implying
that at the 0.5 normalized frequency (ν=0.5) the center separation between two
bright MTF lines is still only 1.26 arc seconds. Maximum contrast drop for obstructed apertures
is around 1/3 normalized frequency, i.e. 3.3 arcs seconds line separation. That is about 1/12 of
the average angular size of Jupiter, and close to the resolving limit for bright
low-contrast details.
Obstruction size of D/3 (i.e. o=0.33) is often compared in the effect to 1/4 wave
of spherical aberration, but the normalized MTF shows significant differences
in the low-to-medium vs. high frequency range. Compared to generalized 1/4 wave
(0.0745 RMS) aberration - very similar to 0.26 wave P-V of defocus - obstructed aperture
has larger drop in the low-to-medium range, bouncing up to the levels higher than
perfect unobstructed aperture in the high frequency range. Considering that most of
observable details are in the left half of the MTF graph (i.e. those about twice the
stellar resolution limit, or larger), the advantage of obstructed aperture in
the high frequency range is less important than its disadvantage in the low-to-medium
range. For instance, cutoff frequency (ν=1) for 100mm aperture is 1.13 arc seconds, implying
that at the 0.5 normalized frequency (ν=0.5) the center separation between two
bright MTF lines is still only 1.26 arc seconds. Maximum contrast drop for obstructed apertures
is around 1/3 normalized frequency, i.e. 3.3 arcs seconds line separation. That is about 1/12 of
the average angular size of Jupiter, and close to the resolving limit for bright
low-contrast details.
